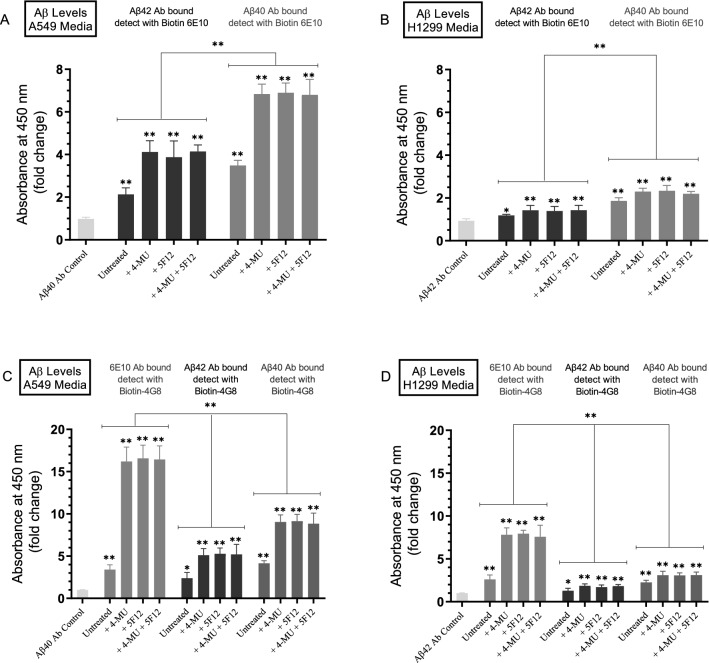
Figure 2.
Higher levels of Aβ40 and Aβ42 are found in the media of A549 cells as compared to that of H1299 cells. Cells (0.2 × 10⁵) were grown in 10% FBS-supplemented media for 24 h then incubated in serum-free media for 24 h and treated as indicated for 72 h with 600 µM 4-MU and/or the CD44 antibody (5F12, 5 μg/mL). The media was then collected and the same amount of protein (3 µL of 600 µg/mL total protein) of each sample was used to quantitate Aβ (“Methods” section) using the indicated antibodies. Data from five independent assays, each carried out in triplicate, were quantitated, averaged, normalized, and expressed as fold change relative to controls including all components but using 6E10 antibodies instead of biotin-6E10 (A,B) or 4G8 antibodies instead of biotin-4G8 (C, D) using the GraphPad 8.4.3 software. The graphs summarize the results expressed as means ± SD (n = 5). Asterisks (*) indicate a statistically significant difference from the corresponding negative control of each cell line, Mann–Whitney test. Statistical differences between different groups were analyzed by an ordinary one-way analysis of variance (ANOVA) followed by Tukey’s post-hoc multiple comparison test. *p < 0.05, **p < 0.01.

