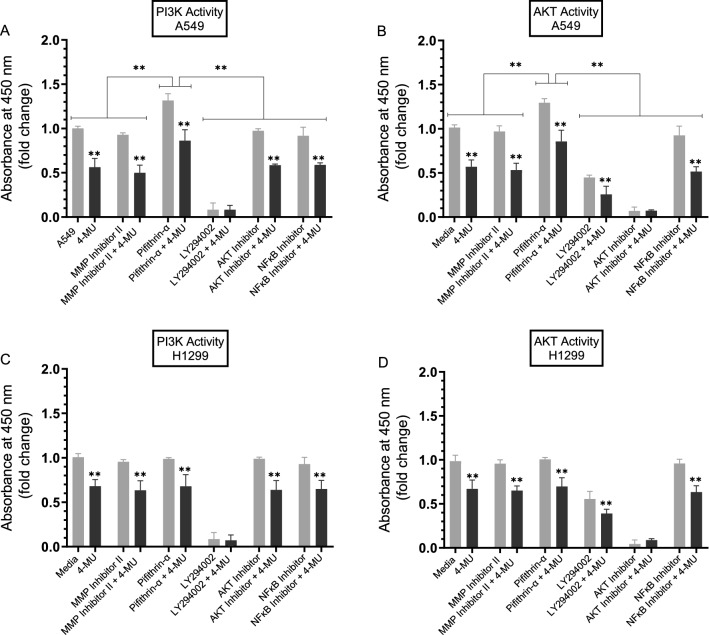
Figure 5.
The activity of either PI3K or AKT is upregulated upon treatment of A549 cells with the p53 inhibitor, pifithrin-α. Cells (0.2 × 10⁵) were grown in 10% FBS-supplemented media for 24 h. The following day, the cell monolayers were incubated in serum-free media for 24 h, then treated as indicated for 72 h with the inhibitors without or with 600 µM 4-MU. The PI3K activity was assayed by the Total In-Cell ELISA Kit and the AKT activity was measured on the same amount of protein (3 µL of 600 µg/mL total protein) of cell lysate as described in the “Methods” section. Data from five independent assays, each carried out in triplicate, were quantitated, averaged, normalized, and expressed as fold change relative to cells not treated with 4-MU using the GraphPad 8.4.3 software. The graphs summarize the results expressed as means ± SD (n = 5). Asterisks (*) indicate a statistically significant difference from the corresponding samples without 4-MU treatment for each cell line, Mann–Whitney test, while the absence of asterisks indicates no significance. Statistical differences between different groups were analyzed by an ordinary one-way analysis of variance (ANOVA) followed by Tukey’s post-hoc multiple comparison test. *p < 0.05, **p < 0.01.

