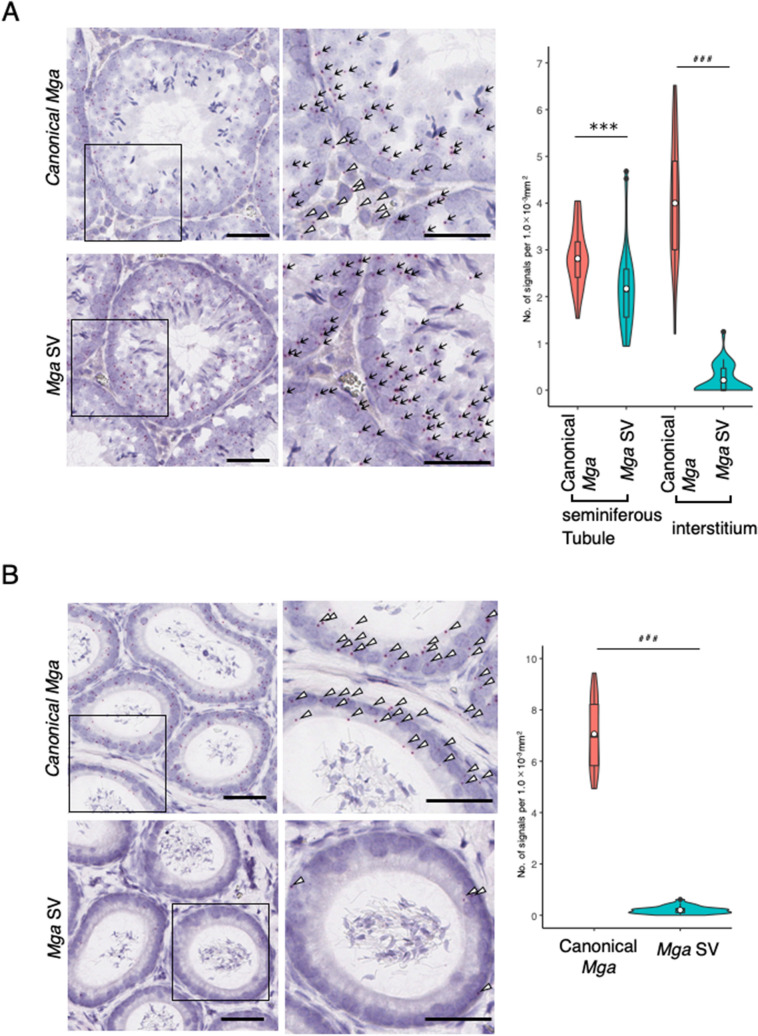
Figure 2.
RNA in situ hybridization analyses of canonical and splice variant Mga mRNAs in the testis and epididymis. (A) Detection of canonical mRNA and its splice variant in adult mouse testis by the BaseScope in situ hybridization. The region indicated with an open square is enlarged and shown at the right. Black arrow and open arrowhead indicate transcripts detected within seminiferous tubule (ST) and interstitium (I) portions, respectively. Black bars correspond to 50 μm. Data obtained as the numbers of positive signals per 1.0 mm−3 area in 35 randomly selected areas were used to construct violin plots. For statistical analyses, F-test values were first obtained for the respective data. Then, the Student’s and Welch’s t-tests were conducted when the F-test value was larger and smaller than 0.05, respectively. ***P < 0.001 (Student’s t-test); ###P < 0.001 (Welch’s t-test) (B) Detection of canonical and splice variant Mga mRNAs in the epididymis by the BaseScope in situ hybridization. Detection of canonical Mga mRNA and its splice variant in the adult mouse epididymis and construction of violin plots as described in A. Black bars correspond to 50 μm. Region indicated with an open square is enlarged and shown at the right. Specific signals for canonical (upper panels) and variant (lower panels) Mga mRNAs are indicated with an open arrowhead. Data were analyzed statistically as described in A. ###P < 0.001 (Welch’s t-test).

