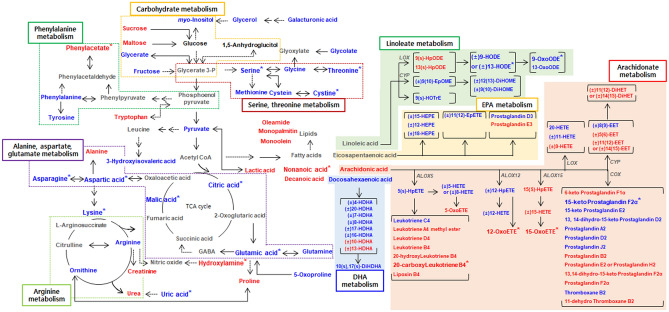
Figure 4.
Schematic diagram of a proposed metabolic pathway using plasma metabolites derived from metabolite and lipid profiling of experimental groups including diabetic macular edema (DME) and non-DME subjects. Metabolites labelled with blue characters indicate that relative metabolite levels were lower in DME cases than in non-DME subjects. Metabolites labelled with red characters indicate that relative metabolite levels were higher in DME cases than in non-DME patients. Asterisks indicate statistically significant differences in levels of metabolites distinguishing DME and non-DME individuals (p < 0.05). The metabolic pathway was
modified from the reported Kyoto Encyclopedia of Genes and Genomes pathway (KEGG, http://www.genome.jp/kegg/).

