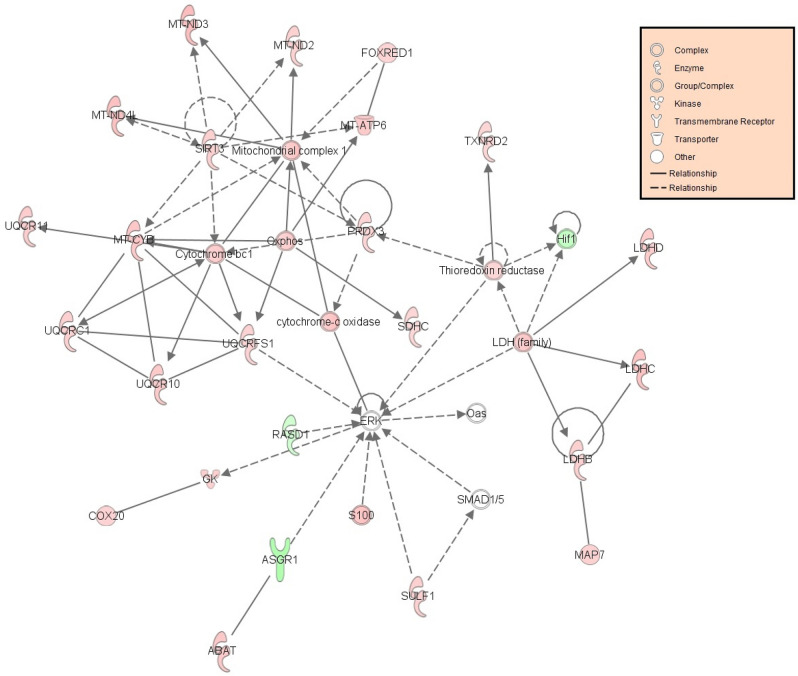
Figure 3.
Small molecule biochemistry and metabolic processes network following altered plane of nutrition for the first 21 weeks of life in visceral adipose of heifer calves. The network (network 12) is displayed graphically as nodes (genes). The node colour intensity indicates the expression of genes; with red representing up-regulation and green, down-regulation in calves fed the High plane of nutrition compared to those fed a moderate plane of nutrition up to 21 weeks of age. The network image was generated through the use of IPA (QIAGEN Inc., https://www.qiagenbio-informatics.com/products/ingenuity-pathway-analysis)24.

