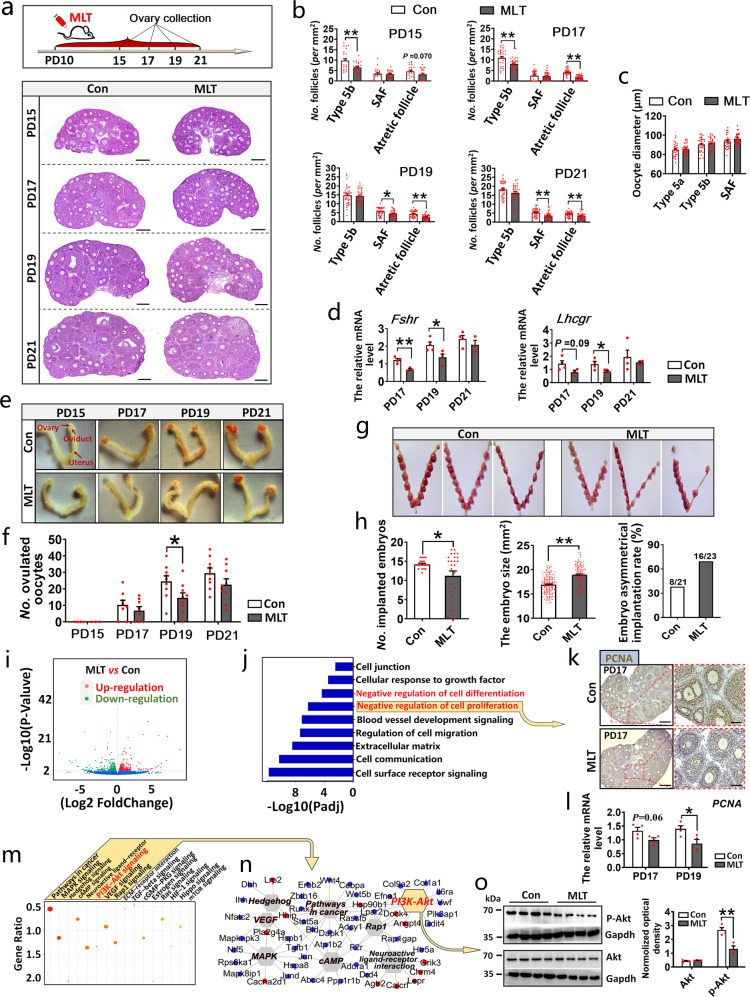
Fig. 4. In vivo MLT intake inhibited early follicle growth and atresia.
a–c The effect of MLT injection on early follicle growth and atresia, and oocyte growth. n = 4 biologically independent mice. a Experimental design and representative photographs of H&E staining in each group. The scale bar = 200 µm. b The statistical charts of the number of early growing follicles and atretic follicles (values are mean ± SEM). c The statistical charts of the number of oocyte diameters (values are mean ± SEM). The number of sections used for statistics: PD15 n = 24; PD17 n = 33 (Con), 35 (MLT); PD19 n = 37 (Con), 34 (MLT); PD21 n = 38 (Con) and 36 (MLT). Statistical significance was determined using two-tailed unpaired Student’s t-test. d The effect of MLT injection on the expression of Fshr and Lhcgr (values are mean ± SEM). Normalization was performed using the housekeeping gene Actb. PD17: n = 4 (Con), 3 (MLT); PD19: n = 4 (Con), 4 (MLT); PD21: n = 4 (Con), 3 (MLT). Statistical significance was determined using two-tailed unpaired Student’s t-test. e, f The effect of MLT injection on the number of ovulated oocytes after superovulation. e Representative photographs of reproductive organs after superovulation. f The statistical chart of the number of ovulated oocytes (values are mean ± SEM). The number of mice used for superovulation: PD15 n = 4 (Con), 3 (MLT); PD17 n = 8; PD19 n = 9; PD21 n = 9. Statistical significance was determined using two-tailed unpaired Student’s t-test. g, h The effect of MLT injection on the number of implanted embryos. g Representative photographs of implanted embryos in each group. h The statistical charts of the number, size, and distribution of implanted embryos. n = 21 (Con), 25 (MLT) biologically independent mice, respectively. Statistical significance was determined using two-tailed unpaired Student’s t-test or χ2-test. i The volcano map of genes. n = 3 biologically independent mice. j GO analysis of differentially expressed genes. k, l The detection of MLT’s effect on PCNA using immunohistochemistry and qPCR, respectively. k Representative photographs of immunohistochemistry. The scale bars are 200 µm in the original images and 50 µm in the enlarged images. l Gene quantification of PCNA (values are mean ± SEM). Normalization was performed using the housekeeping gene Actb. n = 4 biologically independent mice. Statistical significance was determined using two-tailed unpaired Student’s t-test. m, n KEGG analysis of differentially expressed genes. m KEGG analysis of differentially expressed genes. The typical pathways associated with folliculogenesis are shown in yellow box. n Signaling pathways interaction network. The blue dots represent downregulation and red dots represent upregulation. o The detection of MLT’s effect on PI3K-AKT pathway using western blotting. The relative optical density was normalized by the amount of the loading control Gapdh on the same membrane (values are mean ± SEM). The original western blottings can be viewed in Supplementary Fig. 6. n = 4 biologically independent mice. Statistical significance was determined using two-tailed unpaired Student’s t-test. Significant differences are denoted by *P < 0.05 and **P < 0.01.

