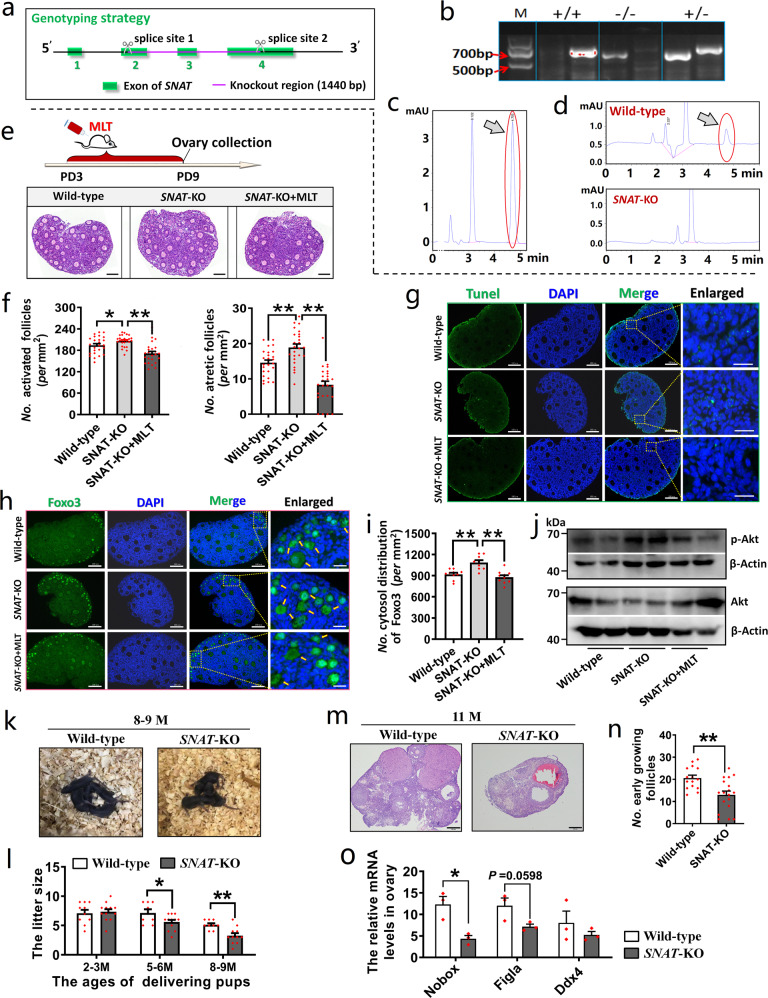
Fig. 5. SNAT-KO in mice accelerated the exhaustion of ovarian follicle reserve and age-related fertility decline.
a Schematic diagram of SNAT knockout in the mouse genome. b The knockout mice were identified by PCR. c, d Detection of the MLT-synthetic ability of SNAT-KO mice. c The absorption peak of MLT appears in the positive control solution with MLT. d Representative chromatograms showed that the MLT absorption peak was visible in serum of wild-type mice but not in SNAT-KO mice. The positions indicated by arrows were MLT absorption peaks. e, f The effects of SNAT-KO and MLT intake on follicle activation and atresia. e Experimental design and representative photographs of H&E staining in each group, the scale bar = 100 µm. f The statistical chart of activated and atretic follicles (values are mean ± SEM). n = 3 biologically independent mice and 25 sections in each group were used for statistics. Statistical significance was determined using one-way ANOVA followed by Tukey’s post hoc test. g Representative TUNEL staining of ovary samples in each group. The green dots represent apoptosis-positive cells. The scale bars are 100 µm in the original images and 20 µm in the enlarged images. h, i The effect of SNAT-KO and MLT intake on FOXO3 translocation in the oocytes. n = 2 biologically independent mice. h Representative photographs of immunofluorescent staining. The yellow arrows indicate cytosolic localization. The scale bars are 100 µm in the original images and 20 µm in the enlarged images. i The statistical charts of FOXO3 translocation (values are mean ± SEM). The number of sections used for statistics: wild-type n = 10; SNAT-KO n = 9; SNAT-KO + MLT n = 10. Statistical significance was determined using one-way ANOVA followed by Tukey’s post hoc test. j The effect of SNAT-KO on PI3K-AKT pathways in ovaries. n = 2 biologically independent mice. The original western blottings can be viewed in Supplementary Fig. 7. k Representative photographs of offspring of female mice at the age of 8–9 months. l The effect of SNAT-KO on litter size (values are mean ± SEM). The number of mice used for mating: 2–3 M n = 10 (wild-type), 12 (SNAT-KO); 5–6 M n = 8 (wild-type), 12 (SNAT-KO); 8–9 M n = 9 (wild-type), 11 (SNAT-KO). Statistical significance was determined using two-tailed unpaired Student’s t-test. m, n Morphological features of ovaries from 11-month-old SNAT-KO and wild-type group were analyzed. n = 4 biologically independent mice. m Representative photographs of H&E staining in each group. The scale bar = 200 μm. n The statistical chart of early growing follicle (values are mean ± SEM), the number of sections used for statistics: wild-type n = 15; SNAT-KO n = 18. Statistical significance was determined using two-tailed unpaired Student’s t-test. o The expression of oocyte marker genes in SNAT-KO and wild-type groups (values are mean ± SEM). Normalization was performed using the proportion of reverse-transcribed RNA to total RNA. n = 3 biologically independent mice. Statistical significance was determined using two-tailed unpaired Student’s t-test. Significant differences are denoted by *P < 0.05 and **P < 0.01.

