Figure 2.
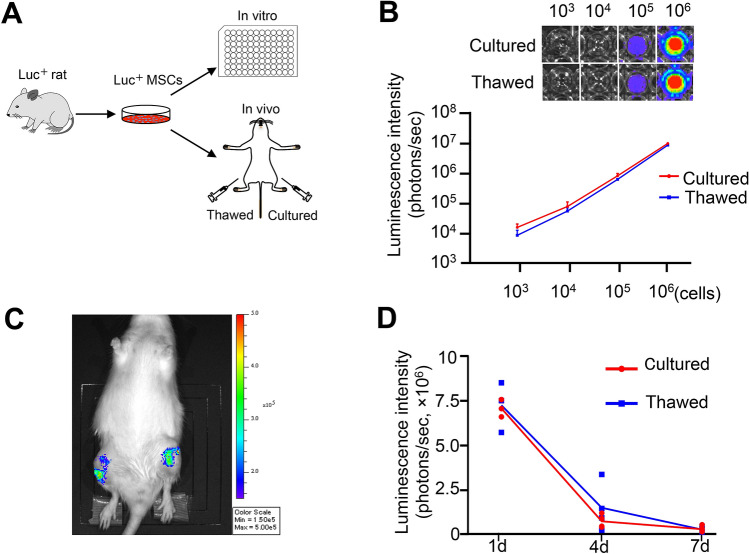
In vitro and in vivo bioluminescence imaging analysis. (A) Scheme: synovial MSCs were derived from luciferase-expressing transgenic rats. Cultured MSCs and thawed croypreserved MSCs were plated into 96-well plates and then used for injection into the knees. (B) In vitro luminescence images and intensity. Synovial MSCs derived from luciferase-expressing transgenic rat MSCs were allocated into samples of 103, 104, 105, and 106 cells and assessed. The average with SD is shown (n = 3). (C) In vivo bioluminescence imaging analysis. The anterior half of the MM in both knees of each rat was removed, 106 cultured MSCs were injected into one knee and 106 thawed cryopreserved MSCs were injected into the contralateral knee without compensation for viability. The scheme and representative images at 1 day are shown. (D) Luminescence intensity. The average is shown as a line graph. 1 day (n = 3), and 4 and 7 days (n = 4).

