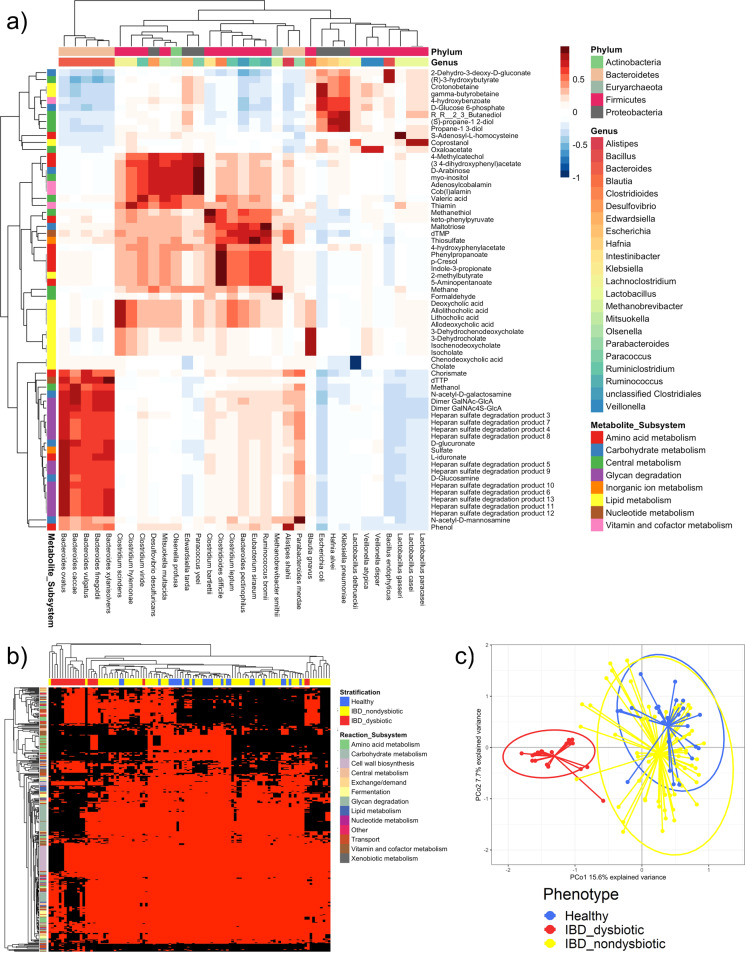
Fig. 3. Metabolic properties and flux profiles computed for the 108 microbiomes.
a Spearman correlations between metabolite secretion fluxes (mmol/person/day) and species-level relative abundances across all 108 microbiome models. Shown are only the 66 metabolites for which the positive or negative correlation with at least one species was higher than 0.75 or lower than −0.75, respectively. Rows show metabolites annotated by subsystem, and columns show species annotated by genus and phylum. b Absolute reaction presence in the 108 microbiome models than differed significantly (p-value corrected for false discovery rate < 0.05, Supplementary Table 4b) between the 20 dysbiotic and 63 dysbiotic IBD microbiomes. Rows show reactions annotated by subsystem, and columns show microbiome models annotated by group. Red = reaction present, black = reaction absent. c Principal coordinates analysis of all 26,873 strain to metabolite contributions (mmol/person/day, Supplementary Table 6) computed for the 108 microbiome models.

