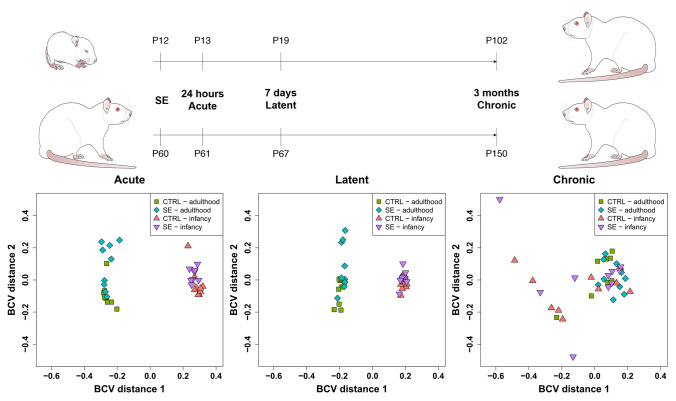
Figure 1.
Timelines and Multidimensional Scaling (MDS) of complete miRNA expression. Timelines depict the age of animals (as a number of postnatal days P) at the status epilepticus (SE) induction and tissue collection separately for individual onset ages (infancy and adulthood). Tissue collection timepoints (24 h, 7 days, and 3 months) correspond with epileptogenesis stages: acute, latent, and chronic. The MDS plot is a clustering method to compute the relative variability of expression among samples and visualize the level of their similarity. The MDS plots were constructed using miRNA expression data (normalized read count from sequencing) and used “Biological coefficient of variation” (BCV) to compute distances. Points represent samples of the adult-onset (blue) and infantile-onset (violet) onset of epilepsy and their controls (adult—green, infantile—red). Individual plots depict clustering in a specific stage of epileptogenesis.

