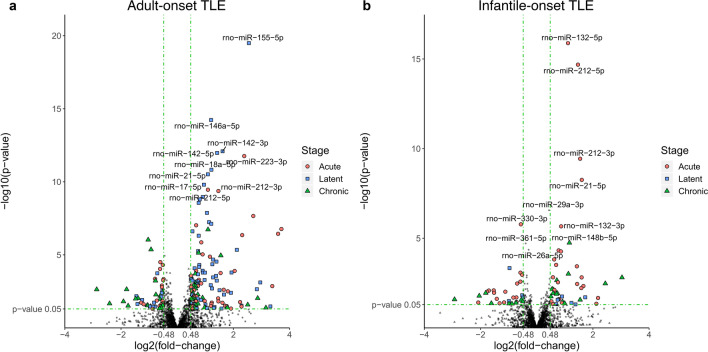
Figure 2.
Expression changes of all miRNAs detected in adult and infantile-onset of epileptogenesis. The volcano plots display changes in miRNA expression after SE induced in adulthood (a) and infancy (b). Scattered points represent individual miRNAs identified by DESeq2. The x-axis specifies the log2 fold-changes (log2(FC)), and the y-axis specifies the negative logarithm to the base 10 of the p-values. Green vertical and horizontal dashed lines reflect the filtering criteria (log2(FC) = ± 0.48 and p-value = 0.05). log2(FC) > + 0.48 indicates miRNA levels increased by > 1.4 times in SE-treated rats, whereas log2(FC) < − 0.48 indicates miRNA levels reduced by > 1.4 times in SE-treated rats. miRNAs significantly dysregulated in the acute stage of epilepsy are depicted by red circle points. miRNAs dysregulated in the latent stage are represented as blue square points, and in the chronic stage, they are represented as green triangle points. Non-significant miRNAs are depicted in black. Ten miRNAs with the highest fold-change difference between SE and control animals in adult and infantile-onset group respectively are labeled.

