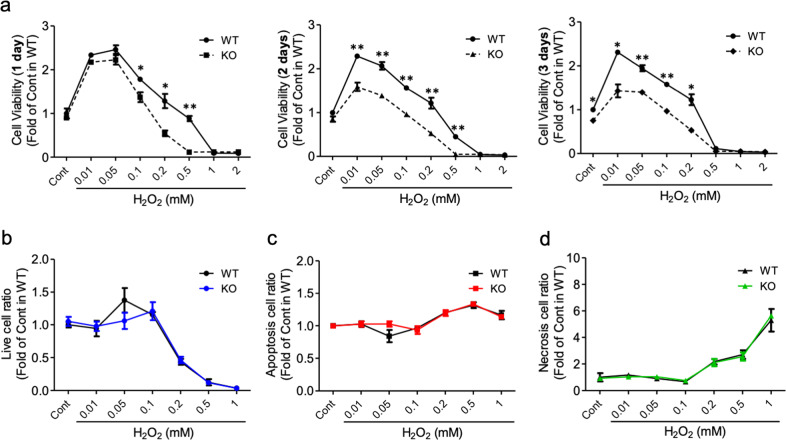
Fig. 3. Optn−/− cells are more sensitive to H2O2-induced cytotoxicity.
a Cell viability of osteoclast precursors in response to various concentrations of H2O2. Each graph indicates a different treatment duration (1, 2, and 3 days). Quantitation of live b, apoptotic c, and necrotic d cells following treatment with various concentrations of H2O2. The cells are shown as a ratio of treated versus control untreated cells. The cells were treated with H2O2 for 1 day and then stained with Annexin V for apoptosis and necrosis before quantitation by flow cytometry. WT, Optn+/+ preosteoclasts; KO, Optn−/− preosteoclasts; Cont, control (growth media only); n = 3 experiments. Data are presented as the mean ± SEM. *p < 0.05, **p < 0.01 compared to Optn+/+ within each dosage group.

