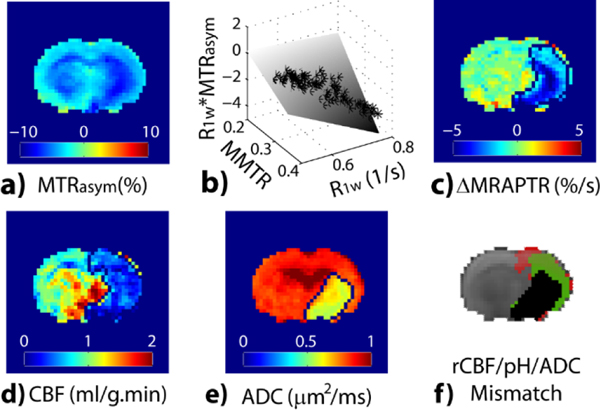
Fig. 3:
Demonstration of pH-specific MRI in an acute stroke rat. a) pH-weighted MTRasym. b) The multilinear regression between MTRasym, R1w and MMTR from the intact tissue, per pixel, correction of which results in c) pH-specific ΔMRAPTR map. Rat perfusion (d) and diffusion (e) images reveal perfusion/pH/diffusion lesion mismatch (Guo et al., Neuroimage 2016:242–9).

