Figure 1.
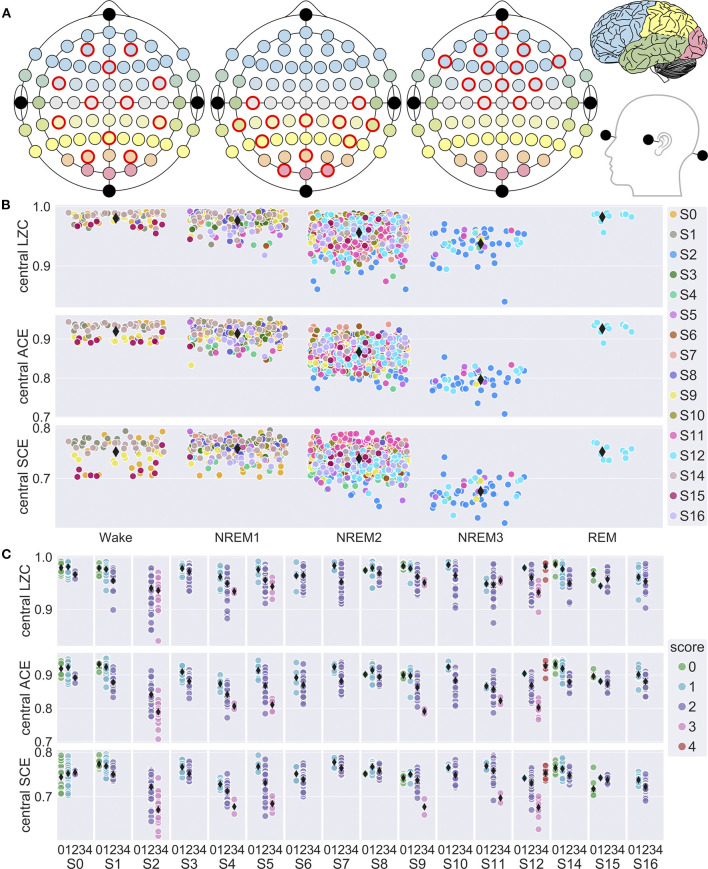
EEG channel selection and variation in signal diversity with sleep stage. (A) Central, posterior and frontal channel selections. Electrode fill color indicates associated cortical lobe [adapted from illustration by Laurens R. Krol, distributed under a CC0 1.0 license (Krol, 2020)]. (B) Mean LZC, ACE and SCE for all 30 s sleep epochs vs. sleep stage for the central channel selection. Observations are randomly jittered along x-axis to reduce overlap, and participant number (S0, …, S16) is indicated by marker fill color. Grand mean values for each sleep stage is indicated by black diamond markers. Most of the data is from NREM2 sleep, because we prioritized the within-state analysis of dream-reports from NREM2. In particular, all REM sleep epochs are from a single sleep trial for Participant 12. (C) Mean central LZC, ACE and SCE for the 30 s sleep epochs vs. sleep stage (0 = W, 1 = NREM1, 2 = NREM2, 3 = NREM3, 4 = REM), plotted separately for each study participant (S0, …, S16). Fill color indicates sleep stage, and diamond markers indicates participant mean values for each stage.

