FIGURE 2.
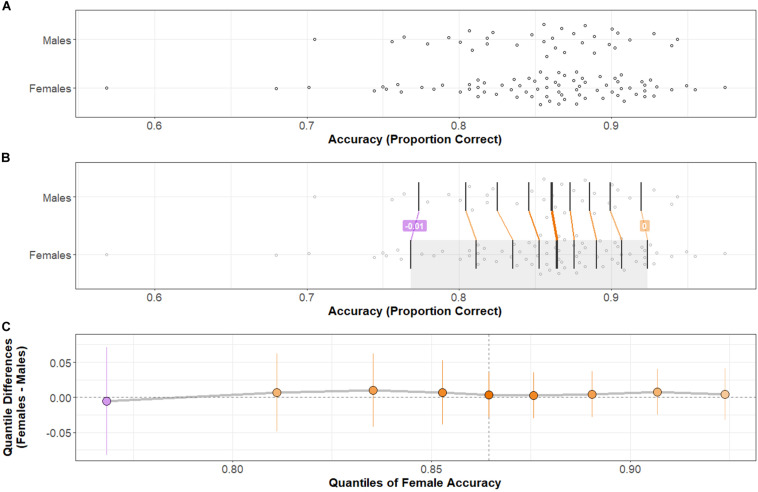
Accuracy distributions by group and comparison by shift function. (A) Stripchart of Accuracy distributions by group. (B) Stripchart shown in (A) with quantiles (vertical black bars) and differences between distribution quantiles characterized. When the difference between quantiles (Females–Males) is negative, the connecting line between corresponding quantiles is purple; when positive, orange. The heavier weight vertical black bar denotes the median (5th quantile) of each distribution. (C) Shift function between Male and Female distributions. Range of the x-axis corresponds to the shaded region of the Female distribution in (B). Y-axis shows the difference between group distributions by quantile: as in (B), purple indicates a negative difference; orange indicates a positive difference. Points indicate how much the Male distribution would need to shift at a particular quantile to match the corresponding quantile in the Female distribution. Vertical lines at each point represent a bootstrapped 95% confidence interval about the difference. Note that difference points all near zero and confidence intervals at every quantile difference point cross over zero: there is no significant difference in Accuracy across Task-types between Females and Males. Two-sample, two-sided Kolmogorov–Smirnov test: D = 0.09, p > 0.5.

