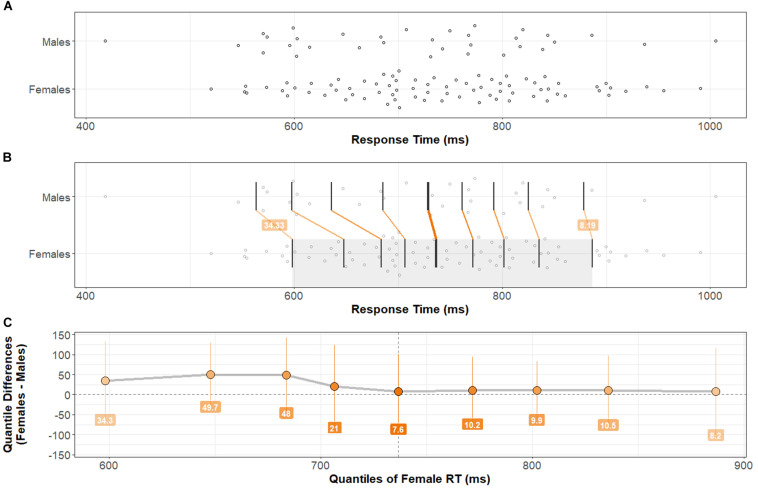
FIGURE 3.
Response Time distributions by group and comparison by shift function. (A) Stripchart of Response Time distributions (mean Response Time across Trial-types) for Males and Females. (B) Stripchart shown in (A) with quantiles and differences between distribution quantiles characterized (see Figure 2 caption for detailed explanation). (C) Shift function between Male and Female distributions. Note that bootstrapped 95% confidence intervals at each quantile difference point cross zero. There is no significant difference in Response Time across Task-types between Females and Males. Two-sample, two-sided Kolmogorov–Smirnov test: D = 0.17, p > 0.4.

