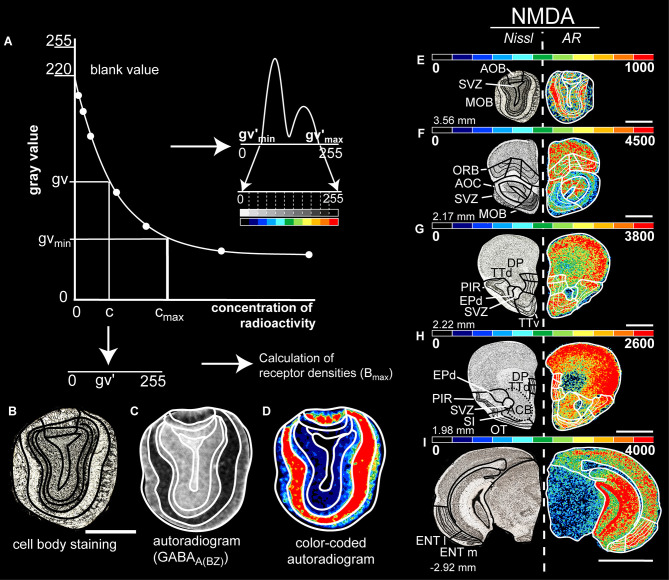
Figure 1.
(A) Calibration curve of the co-exposed isotope standards of known radioactivity for computation of the concentration of the bound ligand. A non-linear dependence of gray values and radioactivity concentration is provided. This allows the gray values of the autoradiograms to be converted pixel by pixel to the corresponding concentration of radioactivity. A gray level histogram of the transformed autoradiogram (C) was generated, followed by a linear contrast enhancement procedure. Here, the gray-scale histogram is transformed into a spectral arrangement of 11 colors to facilitate visualization of the density patterns on the autoradiograms (D). A brain section of the same level with cell body staining (B) is used simultaneously to determine the boundaries. Figure (A) adapted by Zilles and Schleicher (1995) and Herold et al. (2014). (E–I) Exemplary figure of the border identification in color-coded images that shows the distribution and density of glutamatergic NMDA receptors at different Bregma levels (left). The color scale of 11 equally distributed colors corresponds to the densities of receptors in fmol/mg protein. The color scale of each image has been optimized to provide the best visualization for different densities of the receptors. Therefore, the red end corresponds to the best visual fit for the investigated olfactory structure that is not necessarily the maximum density. Scale bars: (B–E), 1.3 mm; (F–H), 1.5 mm; (I), 2 mm; MOB, main olfactory bulb; AOB, accessory olfactory bulb; AOC, anterior olfactory nucleus; TTd, taenia tecta, dorsal; TTv, taenia tecta, ventral; DP, dorsal peduncular cortex; PIR, piriform cortex; EPd, dorsal endopiriform nucleus; ENTl, entorhinal cortex, lateral; ENTm, entorhinal cortex, medial; ORB, orbitofrontal cortex; OT, olfactory tubercle; SVZ, subependymal zone; SI, substantia innominate.

