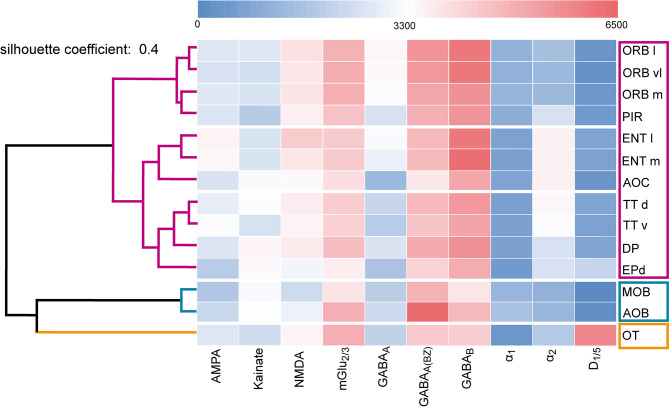
Figure 10.
Dendrogram of the hierarchical cluster analysis. The area-specific receptor densities are displayed as a heat map according to their classification into clusters (Figure 11). The color legend represents the receptor densities (fmol/mg protein). Red color indicates high values (>3,300 fmol/mg protein), while blue color displays lower values (<3,300 fmol/mg protein). For abbreviations see (Figure 1).

