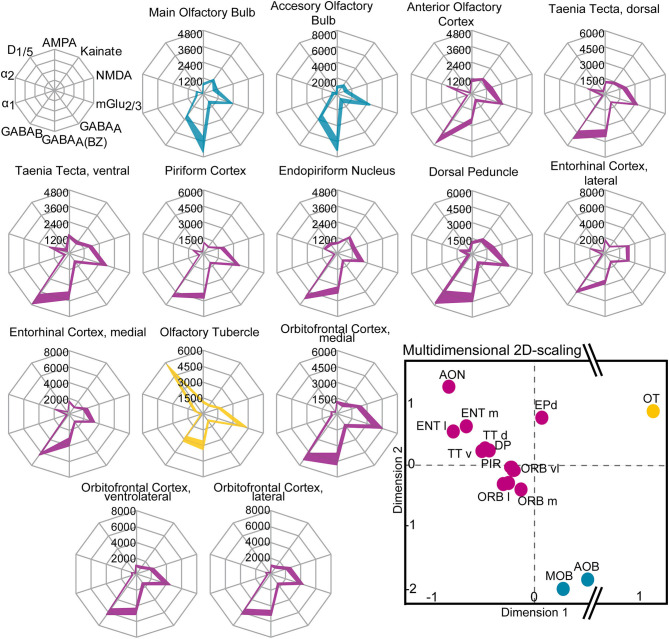
Figure 11.
Receptor fingerprints of the 14 investigated olfactory areas. Mean densities (in fmol/mg protein) are provided for each individual receptor type, connected by a colored line (colors are similar to the multidimensional 2D-scaling analysis). The positions of the receptors are shown schematically in the first row. Filled areas mark upper and lower standard errors of the mean values of the receptor densities (± SEM). Lower right: Receptor-driven multidimensional 2D-scaling of the olfactory system. The dots represent a receptor feature vector, based on the area-specific multi-receptor balance of all investigated receptors (averaged over ten animals/hemispheres). The closer the dots, the smaller the Euclidean distance and the higher the similarity of the receptor architecture of the investigated areas. The hierarchical cluster analysis resulted in a three-cluster solution: the olfactory relay centers (blue), the cortical olfactory areas (violet) and the olfactory tubercle (yellow). The olfactory tubercle shows the highest Euclidean distance from all other areas (interruption of the X-axis, dimension 1). For abbreviations see (Figure 1).

