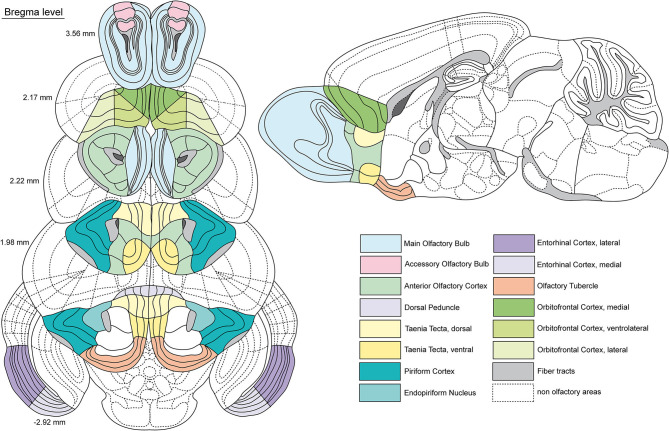
Figure 2.
Schematic representation of the investigated olfactory areas. Coronal sections of the mouse (C57BL/6) brain along the anterior-posterior axis (related Bregma levels alongside). A sagittal section serves for further local orientation of certain areas. The investigated areas are indicated by different colors (see legend). Dashed lines show non olfactory areas for a better orientation. Gray areas show fiber tracts, whereas dark gray areas represent the subventricular zone. Boundaries adapted by the Allen Brain Reference Atlas (Lein et al., 2007; Dong, 2008).

