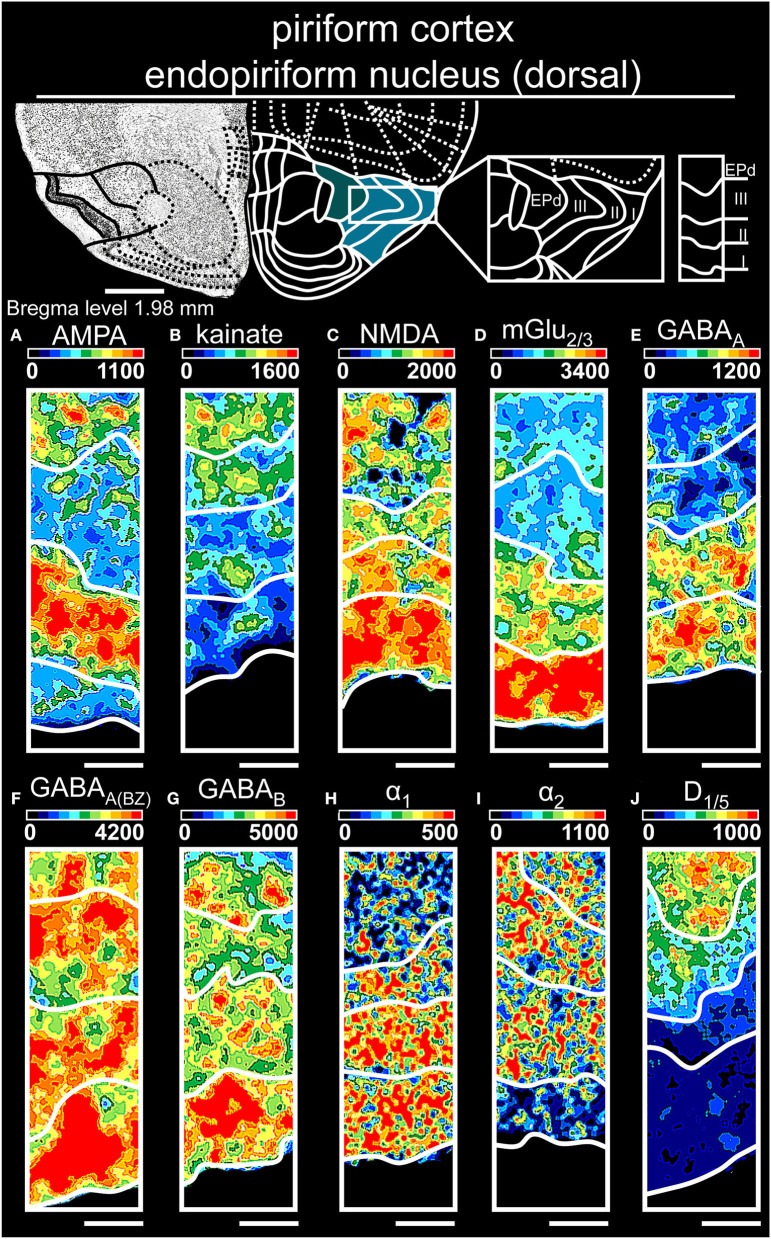
Figure 6.
Color-coded autoradiographs showing the distribution and density of all investigated receptors of the piriform cortex and endopiriform nucleus (dorsal). Densities of the color-coded autoradiograms in fmol/mg protein according to color scales. For detailed receptor densities see Table 1. Scale bars: Atlas, 1.2 mm; (A–J), 400 μm; EPd, dorsal endopiriform nucleus. I, layer 1; II, layer 2; III, layer 3.

