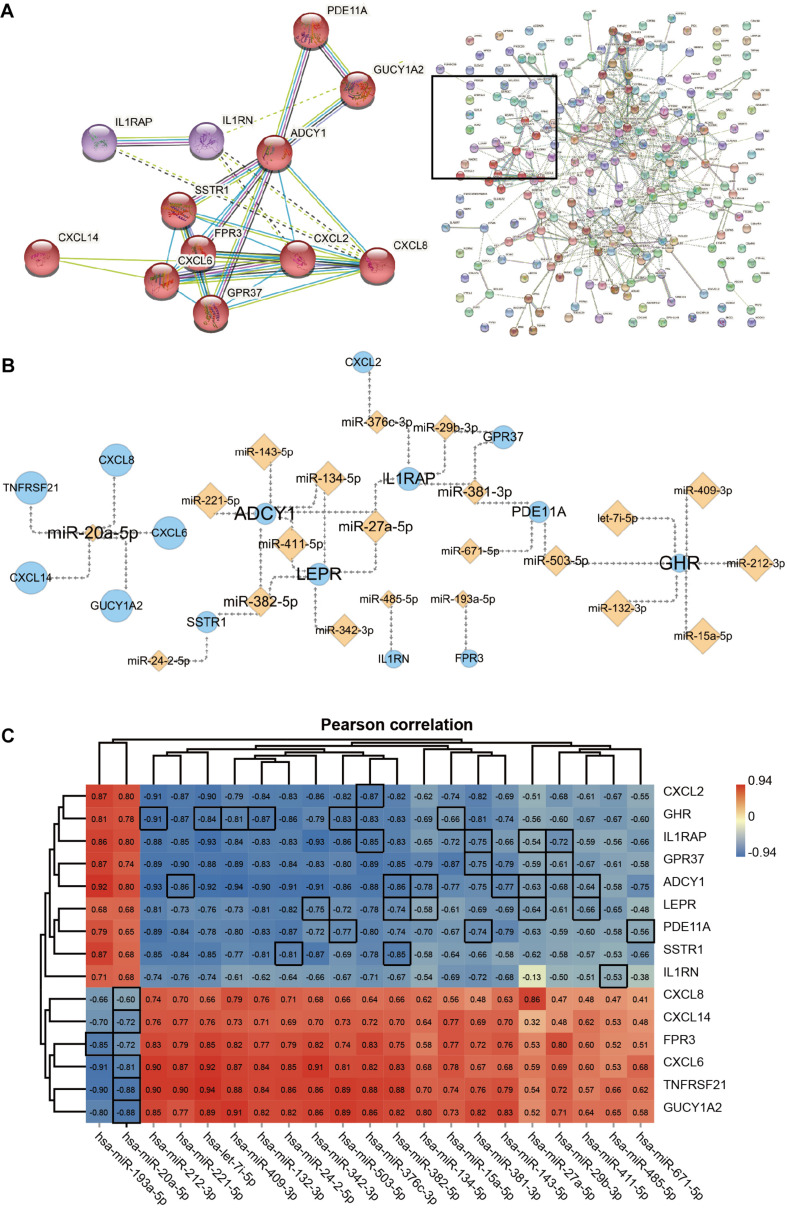
FIGURE 5.
The network of Hub genes and miRNAs. (A) Protein-protein interaction (PPI) network and 12 DEGs in the core modules. MCL parameter set to 3. (B) Regulatory network of 15 Hub genes with miRNAs. Orange diamond points represent miRNAs, and blue circle points represent Hub genes. Point and label size represent the node importance index: points, from large to small, represent high to low Neighborhood Connectivity; labels, from large to small, represent high to low Degree. (C) Heat map showing Pearson’s correlation analysis of hub genes with miRNAs. The screened miRNAs show moderate to very strong negative correlations with their target genes. The correlation coefficients of pairs of molecules with target-regulated relationships are highlighted using black borders. Pearson correlation coefficient cut-off of ≥ 0.6. All correlation analyses in the graph are adj. p ≤ 0.001.

