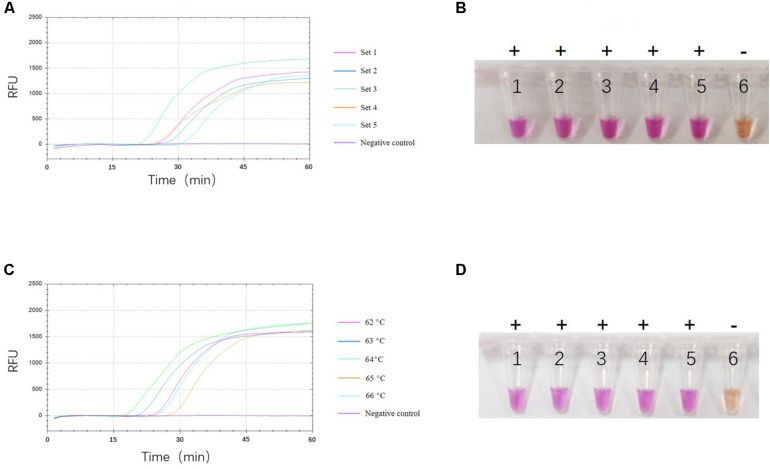
FIGURE 1.
Selection of optimal reaction conditions. Analysis of optimal primer set (A,B) And reaction temperature (C,D) By fluorescence signals and naked eye observation. One representative result of three replicates is shown. (A) Shows the fluorescence signals of the five candidate primer sets. The fluorescence signals at each primer set are shown in a different color. (B) Shows the visual LAMP result of five candidate primer sets, numbers 1 to 6 represent primer set 1, set 2, set 3, set 4, set 5, and negative control, respectively. Positive reactions are shown by “+” and negative reactions are shown by “-”. (C) Shows the fluorescence signals of five different reaction temperatures. The fluorescence signals at each temperature are shown in a different color. (D) Shows the visual LAMP result of five different reaction temperature, number 1 to 6 represent 62°C, 63°C, 64°C, 65°C, 66°C and negative control, respectively. Positive reactions are shown by “+” and negative reactions are shown by “-”.

