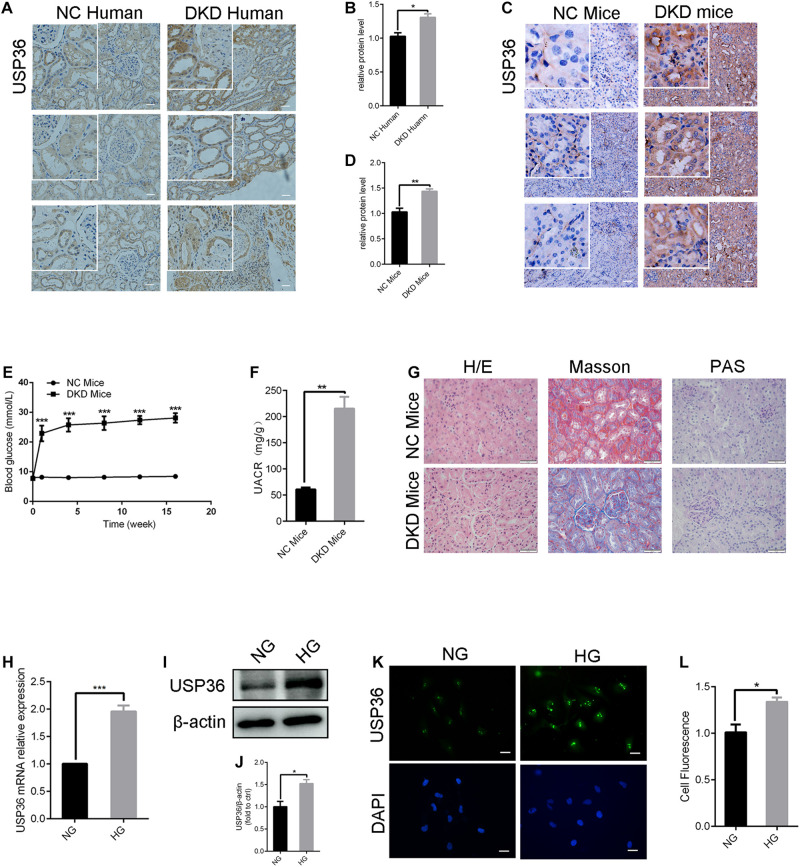
FIGURE 2.
The expression of USP36 is significantly elevated under high glucose conditions in renal TECs both in vivo and in vitro. (A,B) Immunohistochemistry staining for USP36 expression in human kidney sections. NC (normal control) represented the renal histological sections from adjacent normal tissues of patients with renal cell carcinoma. Scale bars = 100 μm, n = 3. (C,D) Immunohistochemistry staining for USP36 expression in mouse renal tissues. Scale bars = 100 μm. NC (normal control) represented the renal histological sections from the normal male C57BL/6 mice, n = 3. Scale bars, 100 μm. (E) The blood glucose level in NC mice and DKD mice, n = 3, ***p < 0.001. (F) Urine albumin to creatine ratio (UACR) in STZ-induced DKD mice, n = 3, **p < 0.01. (G) Hematoxylin and eosin (H/E) staining, Masson’s trichrome (Masson) staining and Periodic acid-Schiff (PAS) staining in renals from STZ-induced DKD mice. Scale bars = 50 μm, n = 3. (H,I,K) qRT-PCR, western blotting and immunofluorescent staining were performed to detect the USP36 expression in high glucose induced TECs. Scale bars = 50 μm. Unpaired, two-tailed t tests were used, n = 3, ***p < 0.001. (J,L) WB and fluorescence analysis of the protein levels of USP36 in high glucose induced TECs. Data are presented as the mean ± S.D, n = 3, *p < 0.05.

