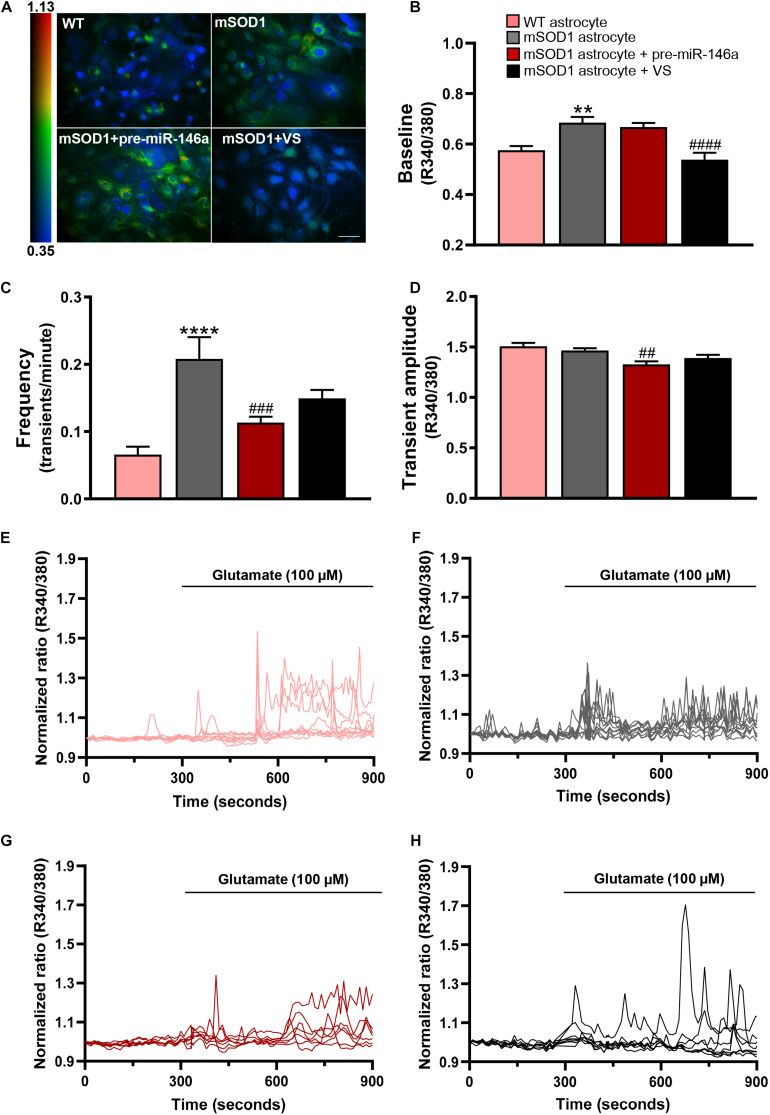
FIGURE 4.
VS reduces the upregulated intracellular Ca2+, while pre-miR-146a normalizes the number and amplitude of glutamate-induced Ca2+ transients in mSOD1 astrocytes. Astrocytes were isolated from the cortex of SOD1-G93A (mSOD1) and wild type (WT) mice with 7-day-old and cultured for 13 days in vitro. Transfection with pre-miR-146a or treatment with dipeptidyl vinyl sulfone (VS) was performed in mSOD1 astrocytes. Cells were incubated at 37°C for 45 min with the calcium (Ca2+) sensitive fluorescent dye fura-2 acetoxymethyl ester (Fura-2), followed by glutamate addition (100 μM). (A) Pseudocolored Fluo4 fluorescence images in WT, untreated and treated-mSOD1 astrocytes show a prominent rise in intracellular Ca2+ and respective (B) changes in the baseline of Fura-2 fluorescence. The color code refers to the fluorescence ratio 340 nm/380 nm, with higher ratio reflecting higher intracellular Ca2+. (C) Summary plot of the frequency of transients per minute and (D) the amplitude of the Ca2+ responses. Results are mean (±SEM) from at least 40 responsive cells from six independent experiments. Representative profiles of normalized Ca2+ responses of at least 8 cells in (E) WT astrocytes and (F) mSOD1 astrocytes treated with (G) pre-miR-146a and (H) VS. The first 300 s represents the changes of Fura-2 fluorescence in the baseline. The remaining 600 s refers to changes after glutamate addition. **p < 0.01 and ****p < 0.0001 vs. WT astrocytes; ##p < 0.01, ###p < 0.001, and ####p < 0.0001 vs. untreated mSOD1 astrocytes. One-way ANOVA followed by Bonferroni post hoc test was used. Scale bar represents 20 μm.

