
FIGURE 6.
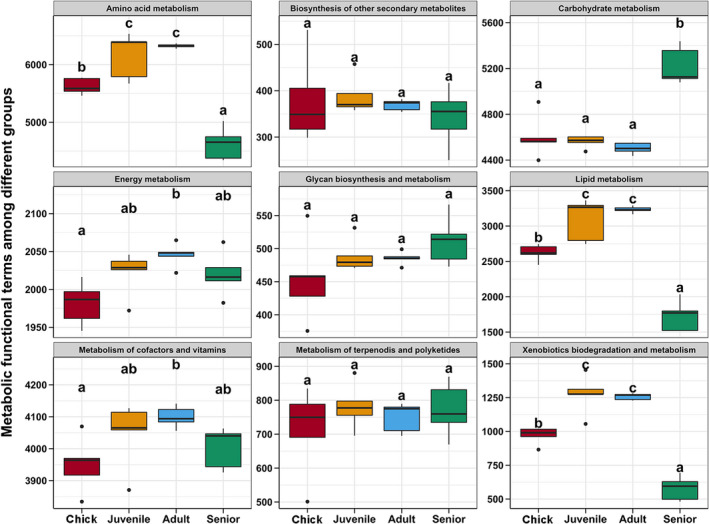
Age‐related differences in predicted metabolic functions of gut microbiota in P. antarctica. Different lowercase letters above each box in the same subfigure represent significant differences between groups (Tukey's HSD test, p < 0.05)
Official websites use .gov
A
.gov website belongs to an official
government organization in the United States.
Secure .gov websites use HTTPS
A lock (
) or https:// means you've safely
connected to the .gov website. Share sensitive
information only on official, secure websites.
Age‐related differences in predicted metabolic functions of gut microbiota in P. antarctica. Different lowercase letters above each box in the same subfigure represent significant differences between groups (Tukey's HSD test, p < 0.05)