
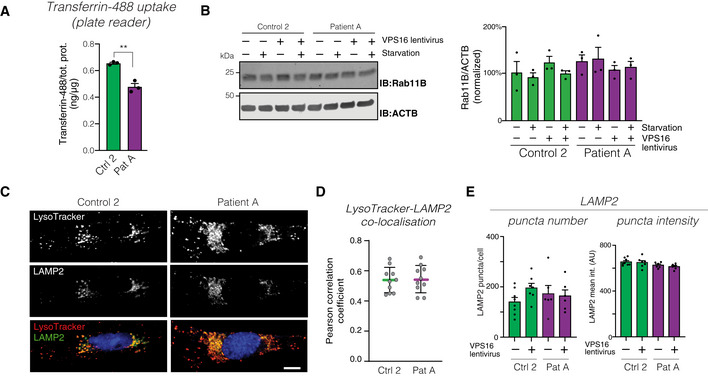
Figure EV4. Analysis of endolysosomal compartments (related to Figs 4 and 5).
-
AQuantification of cellular uptake of fluorescently labeled transferrin in fibroblast lysates, normalized to total protein levels (n = 3 biological replicates). Data represented as mean ±SEM. Statistical comparisons by unpaired two‐tailed Student’s t‐test (n = 3; P = 0.0023). **P < 0.01.
-
BImmunoblot (left) of RAB11B in the indicated fibroblasts, under basal and serum‐starved conditions, and (right) summary quantifications normalized to levels of actin (ACTB) and expressed as % of controls. Bar graphs represent data as mean ±SEM (n = 3 biological replicates).
-
CRepresentative confocal micrographs of fibroblasts stained for LAMP2 and LysoTracker. Scale bar 10 μm.
-
DQuantification of the co‐localization between LysoTracker and LAMP2, expressed as Pearson correlation coefficients. Colored horizontal bars indicate the median values and whiskers 5 and 95 percentiles (n = 10 optical sections from three independent experiments).
-
EQuantification of the number and intensities of LAMP2‐stained puncta. Data represented as mean ± SEM (n = 6).