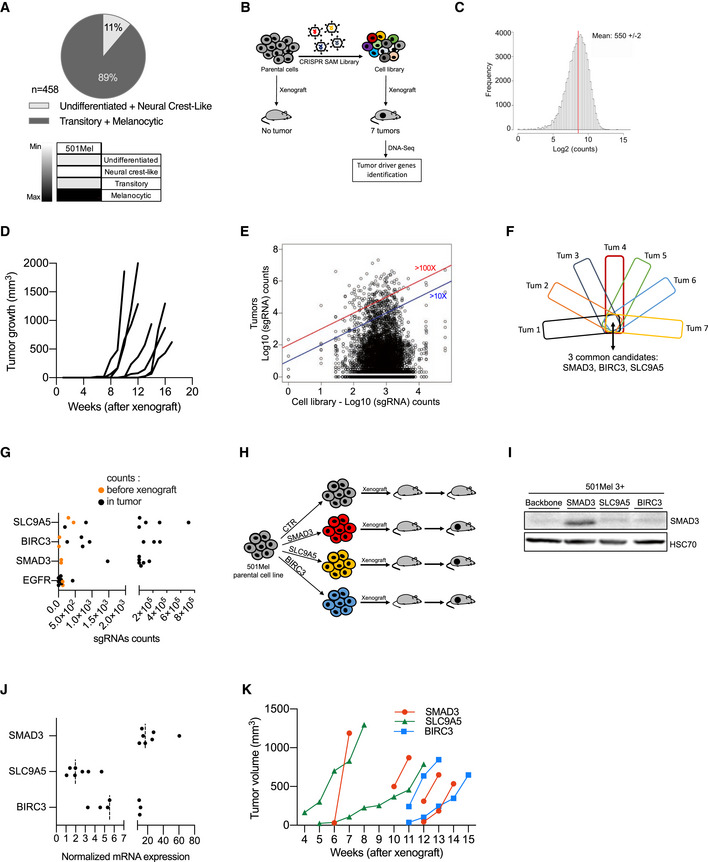
Figure 1. Identification of tumor‐promoting genes by in vivo gain‐of‐function CRISPR screen.

- Determination of differentiation states of skin cutaneous melanoma (SKCM) biopsies from the TCGA cohort (n = 458) according to (Tsoi et al, 2018). The vast majority of these tumors exhibited a differentiated profile (89%; melanocytic and transitory states). The others display a dedifferentiated profile (11%; neural crest‐like cells and undifferentiated states). Human melanoma 501Mel cell line is classified as differentiated melanoma cells (melanocytic cells), according to the gene expression profile (four categories were defined by (Tsoi et al, 2018); melanocytic, transitory, neural crest‐like, and undifferentiated cells). 501mel cell line was selected for the CRISPR screens.
- Workflow depicting the in vivo CRISPR‐SAM screen to identify tumor‐promoting genes. Parental cells and CRISPR‐SAM cell library were xenografted on nude mice (3 × 10⁶ cells/mouse, n = 6 and n = 10, respectively) and tumor growth was monitored during 5 months. Seven tumors were collected and analyzed by DNA‐Seq to identify the sgRNAs (Tables EV1 and EV2).
- sgRNAs distribution in the cell library. sgRNA mean reaches 550 ± 2.
- Tumor growth curves for the 7 tumors arising from the CRISPR‐SAM‐engineered cells xenografted in nude mice as detailed in panel B. (No tumor for the parental cell line (501Mel cells)) (Table EV2).
- Distribution of sgRNAs in cell library and in the 7 tumors (log10(sgRNAs counts)). Blue and red lines indicated the enrichment ≥ 10 fold or ≥ 100 fold (tumors vs cell library (in vitro)) (Table EV1).
- From the seven tumors, the top hundred genes (enriched) have been selected and common genes are SMAD3, BIRC3, and SLC9A5 (Table EV3).
- sgRNA counts in tumors versus in CRISPR‐SAM cell library (respectively, black and orange points). Each black point corresponds to one tumor. Two replicates have been shown for CRISPR‐SAM cell library (orange points).
- Workflow depicting the validation step: 501Mel cells overexpressing SMAD3, BIRC3, or SLC9A5 (obtained by CRISPR‐SAM) were xenografted on nude mice and tumor volume was monitored using caliper. 3 × 10⁶ cells/mouse. n = 7, 6, and 6 mice, respectively.
- SMAD3 expression levels in 501Mel cells overexpressing the cofactors for CRISPR‐SAM approach and the control sgRNA (501Mel 3 + backbone) or the SMAD3 sgRNA. SLC9A5 and BIRC3 sgRNAs are used as controls to show the specificity of the SMAD3 overexpression. HSC70 serve as loading control.
- SMAD3, BIRC3, and SLC9A5 mRNA expression levels in melanoma cell lines described in H and I. n = 7 independent biological experiments. Dashed lines for medians.
- Tumor growth curves from 501Mel cells overexpressing SMAD3, BIRC3, or SLC9A5.
Data information: Western blot results are representative of at least two independent experiments. Source data and unprocessed original blots are available in Appendix Fig S1 source data. See also Fig EV1.
Source data are available online for this figure.
