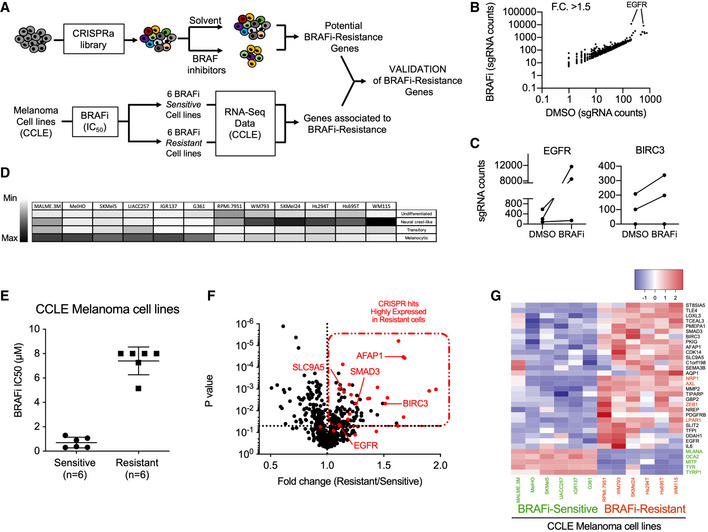
Figure 2. Genome‐wide CRISPR activation screen identifies BRAFi‐resistance genes in cutaneous melanoma.

- CRISPR‐SAM workflow. Cell library was exposed to DMSO (solvent of BRAFi) or BRAFi 2 µM (vemurafenib (Vem) or PLX8394 (PB, Paradox Breaker)) during 14 days. 40 × 106 cells per arm. Experiments were done in duplicate.
- sgRNAs counts in BRAFi‐resistant cells versus in DMSO‐exposed cells for EGFR and BIRC3 (BRAFi for PBV, Appendix Fig S1)
- Determination of differentiation states of 12 human BRAF(V600) melanoma cell lines from CCLE according to (Tsoi et al, 2018).
- BRAF(V600) melanoma cell lines from CCLE were distributed in two groups (Sensitive and “intrinsically” Resistant, n = 6 cell lines per group) according to their BRAFi IC50 (µM, half maximal inhibitory concentrations) (Barretina et al, 2012). Error bars reflect mean ± s.d.
- Volcano plot showing the expression levels of BRAFi‐resistant genes (identified in 501Mel by CRISPR‐SAM screen) in 12 human melanoma cell lines. The fold change corresponds to the ratio of expression levels found in resistant and sensitive cell lines. In red: selected genes. EGFR is considered as positive control and SMAD3, BIRC3, and SLC9A5; selected as favorite genes for the next steps. SMAD3, BIRC3, SLC9A5, and AFAP1 are BRAFi‐resistance genes and potent tumor‐promoting genes (Fig 1). Raw data are available in Table EV5 (BRAFi for PBV, Appendix Fig S1)
- Heat map recapitulating the expression levels of the selected hits (red dots in Fig 2F) in BRAFi‐resistant and BRAFi‐sensitive cell lines. Markers of differentiation (MITF, MLANA, OCA2, TYRP1, TYR). In red: resistance genes already published (NRP1, AXL, ZEB1, LPAR1). Scale corresponds to Z scores.
Source data are available online for this figure.
