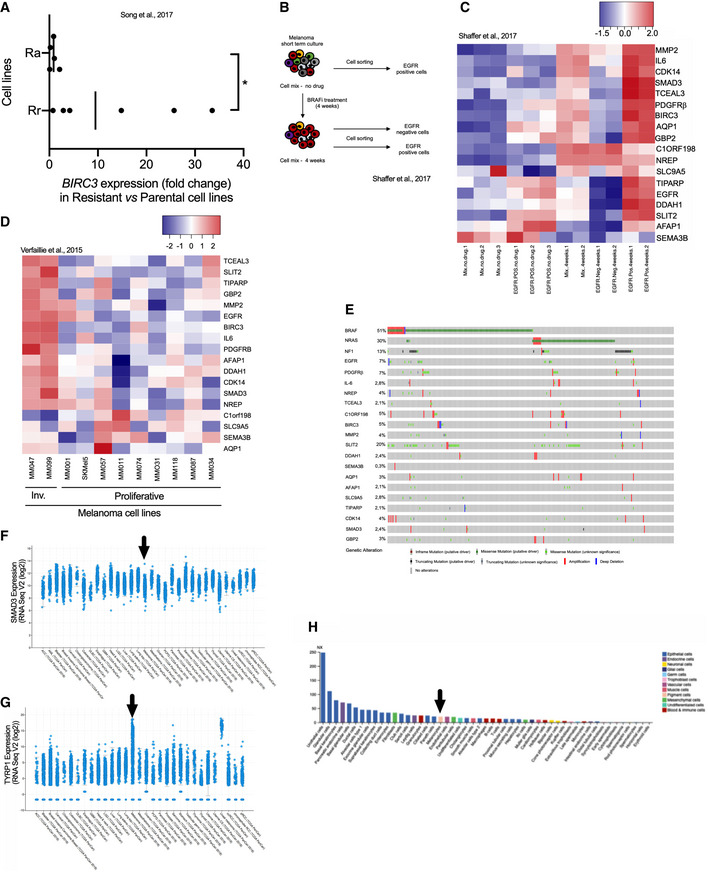
Figure EV2. BRAFi‐resistance genes are associated with invasive phenotype and resistance to BRAFi in vitro and in vivo. Related to Fig 3.

- BIRC3 expression levels (fold change) in melanoma Rr and Ra cell lines. The fold change has been calculated by comparing BIRC3 expression levels in resistant/parental cell lines (Song et al, 2017). Two groups have been made: Rr (n = 6) and Ra (n = 5) cell lines; Ra for resistance and MAPK reactivation and Rr for resistance and MAPK redundant. BRAFi resistance in Ra cell lines is due to additional genetic alterations such as BRAF splicing events for M395 SDR. BRAFi resistance in Rr cell lines is due to gene expression reprogramming. Two‐tailed Mann–Whitney test, P = 0.0303. Vertical bars correspond to the medians.
- Schematic representation of the workflow. As described in the original paper (Shaffer et al, 2017), fresh melanoma cells were obtained by patient tumor dissociation. Cells mix was treated with BRAFi. Cell sorting (EGFR positive and/or negative) was performed at two time points: before treatment (no drug) and after 4 weeks of treatment. Cells “mix” corresponds to the unsorted population. The EGFR‐positive cells (exposed to BRAFi) are able to produce colonies.
- Heat map depicting mRNA expression of BRAFi‐resistance genes, using an RNA‐Seq dataset obtained from BRAFi‐treated melanoma cells (Shaffer et al, 2017). Scale corresponds to Z scores.
- Heat map illustrating the expression levels of BRAFi‐resistance genes in invasive (Inv.) and proliferative melanoma cell lines (n = 2 and n = 9, respectively) (Verfaillie et al, 2015). Scale corresponds to Z scores.
- Genomic alterations in 18 BRAFi‐resistance genes identified in Fig 3 (from www.cbioportal.org). BRAF, NRAS, and NF1 have been added according to melanoma classification (Akbani et al, 2015).
- SMAD3 expression levels (RNA Seq V2 (log2) in the TCGA dataset. Picture was downloaded from www.cbioportal.org. Arrow indicates cutaneous melanoma.
- TYRP1 expression levels (RNA Seq V2 (log2) in the TCGA data set. Pictures were downloaded from www.cbioportal.org. Arrow indicates cutaneous melanoma. TYRP1 is highly expressed in drug‐naive tumors; cutaneous and uveal melanoma in contrast to SMAD3.
- SMAD3 expression and cell types (https://www.proteinatlas.org/ENSG00000166949‐SMAD3/celltype). The consensus normalized expression (NX) value for SMAD3 and organ/tissue represents the maximum NX value in the three data sources (HPA, GTEx, and FANTOM5). Black arrow highlights the melanocytes.
Source data are available online for this figure.
