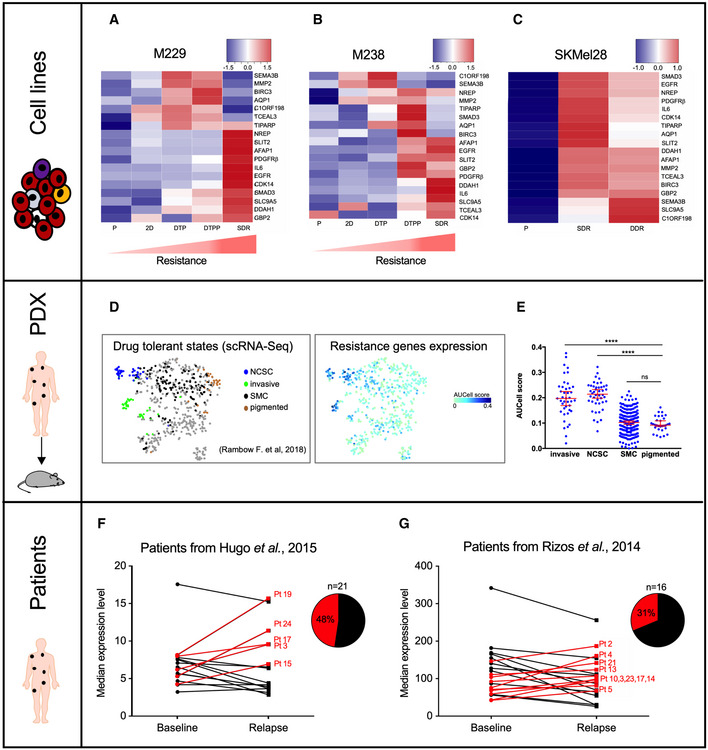
Figure 3. Validation of BRAFi SAM‐selected resistance genes.

- Expression levels of our hits in M229 melanoma cells during the BRAFi‐resistance acquisition. P: parental cells, 2D: two days of treatment, DTP: drug‐tolerant persister cells, DTPP: drug‐tolerant proliferating persister cells, SDR: single‐drug‐resistant cells (BRAFi) (Song et al, 2017). Scale corresponds to Z scores.
- Expression levels of our hits in M238 melanoma cells (Song et al, 2017) during the BRAFi‐resistance acquisition. Scale corresponds to Z scores.
- Expression levels of our hits in parental, single‐drug‐resistant (SDR, BRAFi), or dual drug‐resistant (DDR, BRAFi + MEKi) SKMel28 melanoma cell lines (Song et al, 2017). Scale corresponds to Z scores.
- T‐distributed Stochastic Neighbor Embedding (t‐SNE) plot showing the 4 drug‐tolerant states (NCSC (neural crest stem cells), invasive, SMC (starved‐like melanoma cells) and pigmented cells) according to single‐cell RNA‐seq (scRNA‐Seq) performed in PDX MEL006 model exposed to BRAFi + MEKi (Rambow et al, 2018). Our BRAFi‐resistance genes are mainly expressed in NCSC and invasive cells.
- AUCell score for each drug‐tolerant states. ****P < 0.0001, Mann–Whitney test.
- Expression level of our genes (median) in cutaneous melanoma biopsies before the BRAFi treatment (baseline) and during the relapse. Cohort from (Hugo et al, 2015b). The expression level of our BRAFi‐resistance genes is increased in relapse samples (48%, n = 21).
- Expression level of our genes (median) in cutaneous melanoma biopsies before the BRAFi treatment and during the relapse. Cohort from (Rizos et al, 2014). The expression level of our BRAFi‐resistance genes is increased in relapse samples (31%, n = 16).
Data information: See also Fig EV2.
Source data are available online for this figure.
