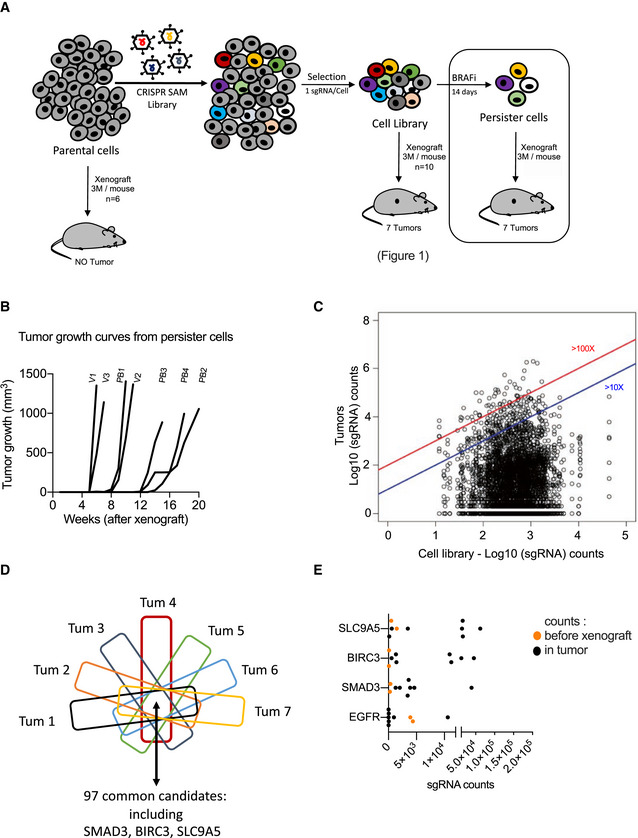
Figure 4. BRAFi‐resistance genes promote tumor growth.

- Tumor growth curves from BRAFi‐persister cells (monitored during 5 months; Table EV2). V for Vem‐resistant cells and PB for PLX8394‐resistant cells.
- Distribution of sgRNAs in BRAFi‐resistant cells (before xenograft) and in the 7 tumors emerging from the BRAFi‐resistant cells (log10(sgRNAs counts)). Blue and red lines indicated the enrichment ≥ 10 fold or ≥ 100 fold (tumors versus BRAFi‐resistant cells (in vitro)). Raw data are available in Table EV7.
- From the seven tumors arising from BRAFi‐resistant cells, the common genes (enriched) have been extracted. Ninety‐seven genes including SMAD3, BIRC3, and SLC9A5 are detected in all these 7 tumors. Raw data are available in Table EV7.
- sgRNAs counts in tumors versus sgRNA detected in BRAFi‐resistant cell library (in vitro) (respectively, black and orange points) for selected candidates. Each black point corresponds to one tumor. EGFR was the most potent BRAFi‐resistant gene (Fig 2). Two replicates have been shown for CRISPR‐SAM cell library (orange points). SMAD3, BIRC3, and SLC9A5 were identified as hits in the three screens (Figs 1, 2, and 4).
Source data are available online for this figure.
