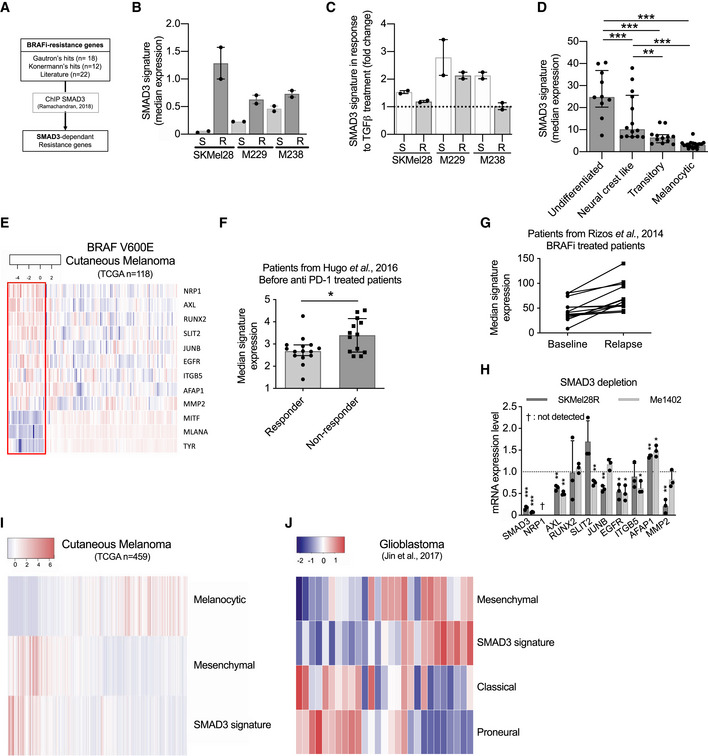
Figure 7. SMAD3 drives phenotype switching and resistance to melanoma therapies.

- SMAD3 signature has been established by comparing BRAFi‐resistance genes and SMAD3‐regulated genes identified by chromatin immunoprecipitation followed by DNA sequencing (ChIP‐Seq) (Ramachandran et al, 2018).
- Basal SMAD3 signature in six melanoma cell lines (S for sensitive to BRAFi and R for Resistant). n = 2 biologically independent experiments. Each histogram represents the median with interquartile range.
- Inducibility of SMAD3‐signature in six melanoma cell lines exposed to TGF‐β (10 ng/ml, 48 h). Data were normalized to cell lines exposed to solvent (4 mM HCl + 1 mg/ml human BSA). Values obtained with the TGF‐β stimulated M238R cell line have been set to 1. n = 2 biologically independent experiments. Each histogram represents the median with interquartile range.
- SMAD3 signature discriminates differentiation states of 53 melanoma cell lines (Tsoi et al, 2018). The SMAD3 signature in four subgroups of melanoma cell lines. Each point represents a cell line (n = 17, 12, 14, and 10, respectively, for melanocytic, transitory, neural crest‐like, and undifferentiated cell lines); each histogram represents the median with interquartile range; multiple comparisons have been done using ordinary one‐way ANOVA; **P < 0.01, ***P < 0.001.
- Heat map depicting mRNA levels of SMAD3 signature in BRAF (V600E) non‐treated melanoma patients (dataset from TCGA; SKCM, BRAF(V600E) mutated: n = 118). Three pigmentation genes (MITF, MLANA, and TYR) have been added to highlight the differentiation states of tumors. ~20% of tumors are considered as dedifferentiated tumors (red box) with a high SMAD3 signature. Scale corresponds to Z scores.
- SMAD3 signature in pre‐treatment biopsies from responders and non‐responders to anti‐PD‐1 treatment (from Hugo’s cutaneous melanoma cohort, n = 15 and 13, respectively) (Hugo et al, 2016). Each histogram represents the median with interquartile range, one‐tailed Mann–Whitney test; *P = 0.0324.
- SMAD3 signature in two groups (before BRAFi treatment or during relapse) of V600E patients from Rizos’s cohort (Rizos et al, 2014) (14 on 16 patients displayed an upregulation of SMAD3 signature during relapse).
- SMAD3 depletion decreases expression of SMAD3‐regulated genes. SMAD3 knock‐down by siRNA decreased mRNA expression of BRAFi‐resistance genes in SKMel28R and Me1402. NRP1 mRNA was not detected in our experimental conditions. n = 3 biologically independent experiments. Each histogram represents the mean ± s.d.; Bilateral Student test (with non‐equivalent variances) *P < 0.05, **P < 0.01, *** P < 0.001. Dotted line highlights the value of 1.
- SMAD3 signature overlapped with mesenchymal signature in melanoma tumors (TCGA, n = 459) (Akbani et al, 2015). Melanocytic signature highlights the differentiation states of tumors (Corre et al, 2018). SMAD3 signature and mesenchymal signature correlate in melanoma tumors (TCGA, n = 459) (Mak et al, 2016). Scale corresponds to Z scores.
- The SMAD3 signature overlaps with the glioblastoma mesenchymal subtype (Jin et al, 2017). Scale corresponds to Z scores.
Source data are available online for this figure.
