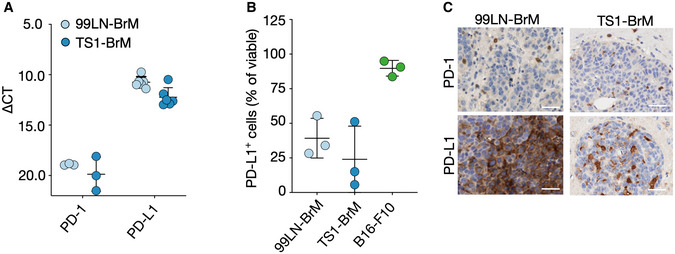
Figure EV2. Expression of PD‐1 and PD‐L1 by breast cancer BrM.

- Expression of PD‐1 and PD‐L1 in the BrM cell lines 99LN‐BrM and TS1‐BrM measured by qRT‐PCR (n = 6 for PD‐L1 and n = 3 for PD‐1).
- Proportion of 99LN‐BrM, TS1‐BrM and B16‐F10 cells positive for PD‐L1 measured by flow cytometry (n = 3).
- Representative IHC images of PD‐1 and PD‐L1 expressing cells in 99LN‐BrM and TS1‐BrM (Scale bars = 50 µm).
Data information: Data in (A + B) are presented as scattered dot plot with lines at mean ± SD.
Source data are available online for this figure.
