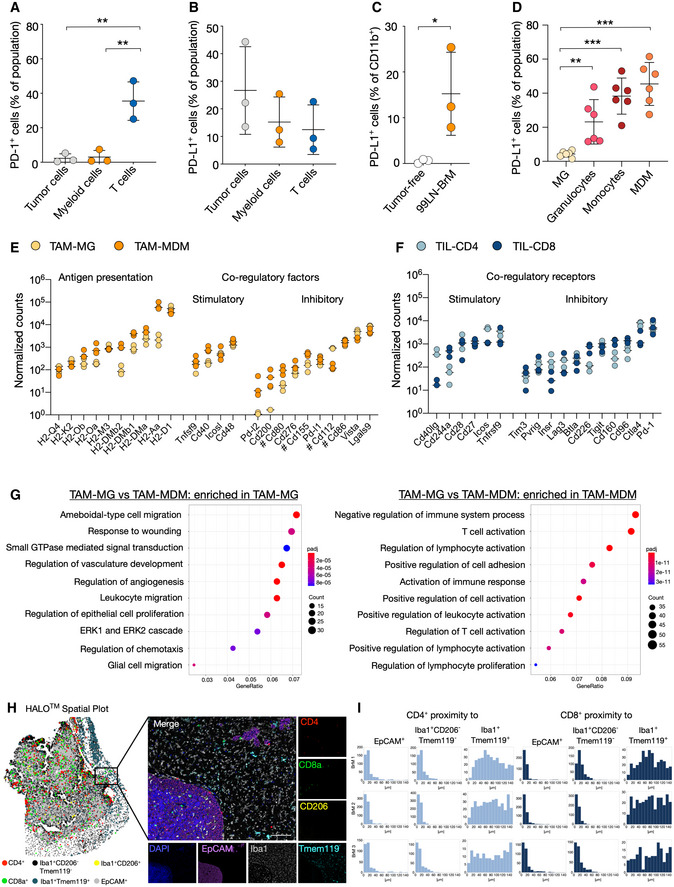
Figure 3. Expression of immune checkpoints in breast‐to‐brain brain metastases.

- Surface expression of PD‐1 in vivo in 99LN‐BrM quantified by flow cytometry (n = 3).
- PD‐L1 in 99LN BrM quantified by flow cytometry (n = 3).
- Flow cytometric analysis of PD‐L1 in tumor‐free brain and 99LN‐BrM (n = 3).
- Flow cytometric analysis of PD‐L1 expression on 99LN‐BrM‐associated myeloid cell types (n = 6).
- Expression of genes associated with antigen presentation and co‐regulatory factors in TAM‐MG and TAM‐MDM. n = 3 per condition. Values are depicted as normalized counts. Genes labeled with # can have stimulatory effects depending on the co‐regulatory receptor on T cells.
- Gene expression of co‐regulatory receptors in TIL‐CD4 and TIL‐CD8. n = 3 per condition. Values are depicted as normalized counts.
- Functional gene annotation of altered cellular pathways in TAM‐MG vs. TAM‐MDM. Left panel depicts pathways enriched in TAM‐MG, and right panel depicts pathways enriched in TAM‐MDM. Adjusted P‐value (Padj) was obtained by Wald test and corrected for multiple testing using the Benjamini and Hochberg method.
- Representative HALO spatial plot showing the spatial distribution of cell types with indicated marker combination in 99LN‐BrM and representative IF images of multiplexed histology. Scale bar; 100 µm.
- HALO proximity histogram depicts the distance (µm) between the indicated cell types for individual mice (n = 3).
Data information: In (A–D), data are represented as scatter dot plot with lines at mean ± SD. In (E + F), data are represented as scatter dot plot with lines at median. P‐values were obtained by unpaired t‐test with *P < 0.05, **P < 0.01, and ***P < 0.001. Exact P‐values can be found in Appendix Table S3.
Source data are available online for this figure.
