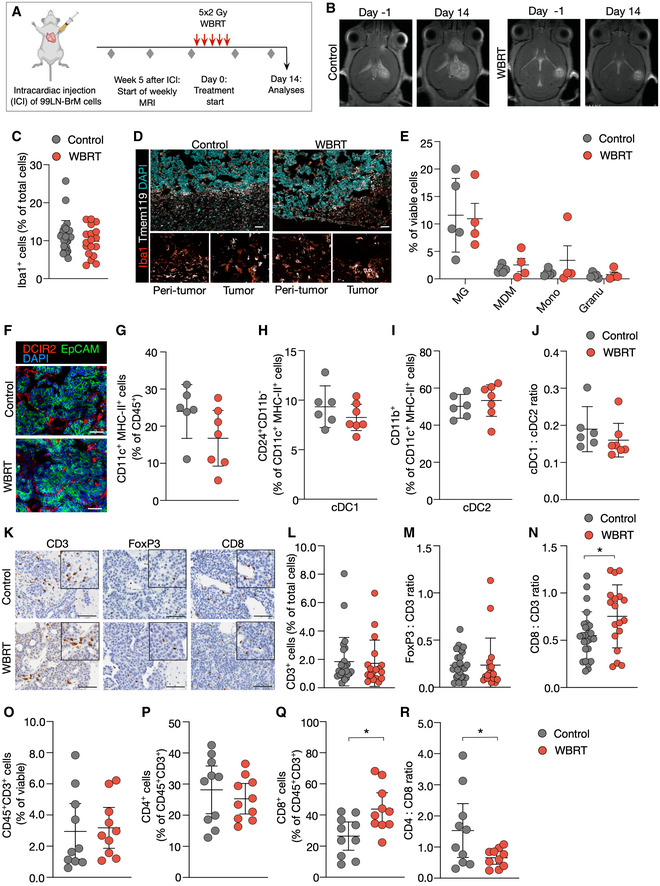
Figure 4. Immune cells in BrM after WBRT.

-
AExperimental design of tumor initiation and application of WBRT.
-
BRepresentative MRI pictures of untreated and irradiated mice at d0 and d14 after treatment start.
-
CQuantification of Iba1+ macrophages in IHC sections of 99LN‐BrM at trial end point (Ctrl n = 27, WBRT n = 18).
-
DRepresentative IF images of 99LN‐BrM stained for the macrophage marker Iba1 (red) and the MG marker Tmem119 (white). Higher magnification images present areas in the peri‐tumor region and in the tumor core. DAPI was used as nuclear counterstain. Scale bar; 100 µm.
-
EQuantification of different myeloid populations in 99LN‐BrM tumors with and without irradiation by flow cytometry at d14 (Ctrl n = 5, WBRT n = 4).
-
FRepresentative IF images of 99LN‐BrM with and without WBRT stained for DCIR2 (red) and EpCAM (green). DAPI (blue) was used as nuclear counterstain. Scale bar; 100 µm.
-
GQuantification of CD11c+MHCII+ immune cells by flow cytometry in 99LN‐BrM with and without WBRT.
-
H, IRelative proportion of cDC1 and cDC2 in 99LN‐BrM with and without WBRT.
-
JcDC1:cDC2 ratio in 99LN‐BrM based on flow cytometry data (H + I).
-
KRepresentative IHC images of CD3+, FoxP3+, and CD8+ T cells in 99LN‐BrM sections with and without WBRT. Scale bar; 100 µm.
-
LQuantification of CD3+ cells in IHC sections of 99LN‐BrM. (Ctrl n = 26, WBRT n = 18).
-
MFoxP3:CD3 ratio in IHC sections of 99LN‐BrM. (Ctrl n = 25, WBRT n = 18).
-
NCD8:CD3 ratio in IHC sections of 99LN‐BrM. (Ctrl n = 25, WBRT n = 18).
-
O–QQuantification of CD3+, CD4+, and CD8+ T cells in 99LN‐BrM tumors with and without irradiation by flow cytometry.
-
RCD4:CD8 ratio in 99LN‐BrM based on data (P + Q).
Data information: In (G–J), n = 6 for control and n = 7 for WBRT. In (O–R), n = 10 for control and for WBRT. In (C + E + G–J + L–N, O–R), data are represented as scattered dot plot with line mean ± SD. P‐values were obtained by unpaired t‐test with *P < 0.05. Exact P‐values can be found in Appendix Table S3.
Source data are available online for this figure.
