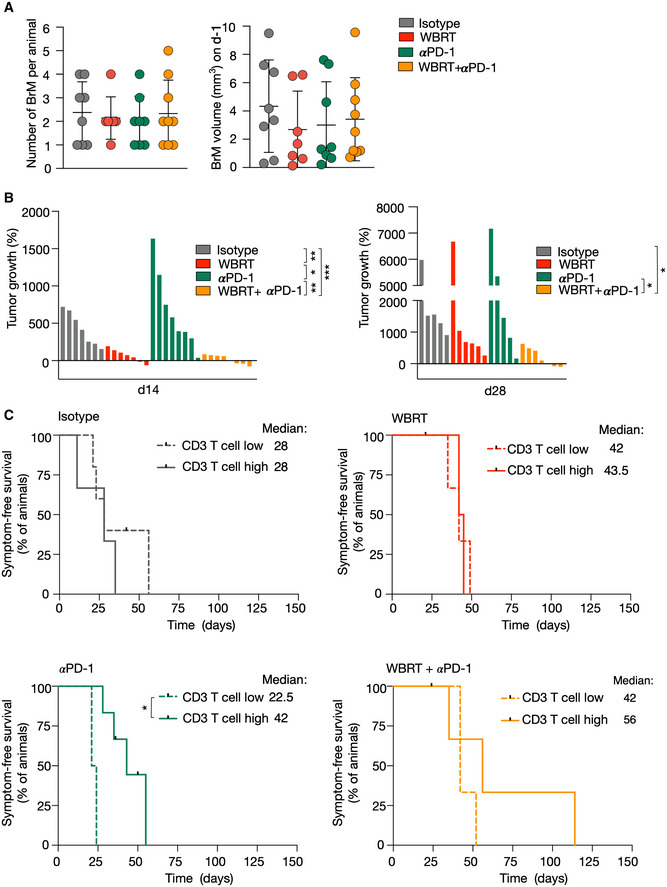
Figure EV4. Efficacy of radio‐immunotherapy in BrM.

- Number and volume of BrM in each treatment group on d‐1.
- Waterfall plots depict percent increase in tumor volume of individual mice in each treatment group on days 14 and 28.
- Kaplan–Meier curves show symptom‐free survival in the respective treatment groups when mice were categorized as CD3 T‐cell high or low subgroups.
Data information: (n = 8, n = 7, n = 8, n = 9 for isotype, WBRT, αPD‐1, WBRT + αPD‐1 group, respectively). Data in (A) are represented as scatter dot plot with line at mean ± SD. P‐values were obtained by unpaired t‐test in (B) and log‐rank test in (C) with *P < 0.05, **P < 0.01, and ***P < 0.001. Exact P‐values can be found in Appendix Table S3.
Source data are available online for this figure.
