
Figure 5. Analysis of T‐cell receptor repertoires in BrM and CLN.
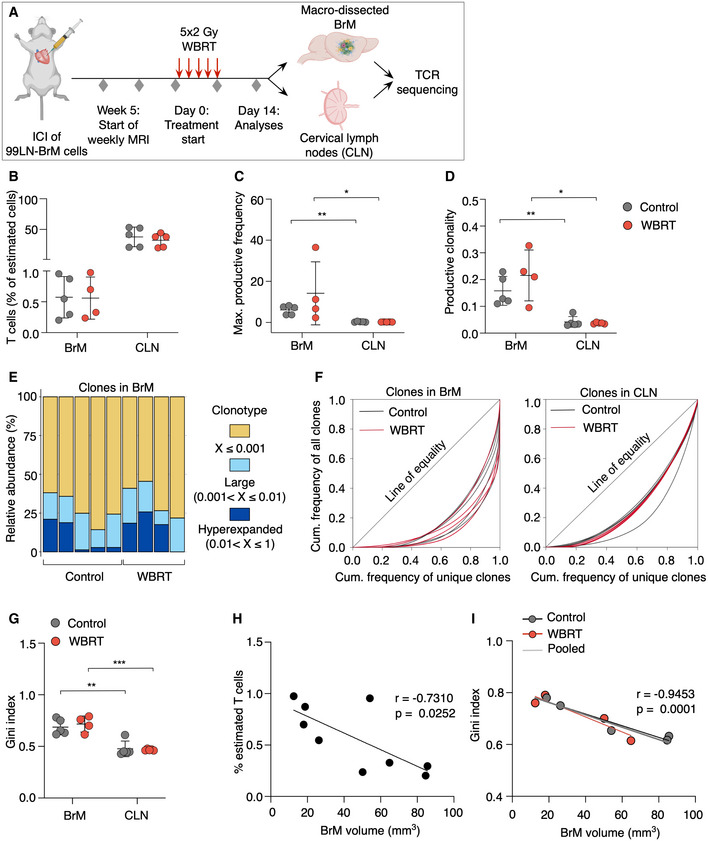
- Experimental design of TCR sequencing.
- Percent T cells of estimated cells in BrM and CLN of mice from control or WBRT group.
- Maximal productive frequency of clones in BrM and CLN samples.
- Productive clonality in BrM and CLN samples.
- Clonal space homeostasis of BrM samples indicating the relative abundance of clones with a specific frequency.
- Lorenz curves generated with the reads of all clones in a sample to visualize deviation from perfect equality.
- Lorenz curves were used to determine the Gini index of each sample, which is a measure of inequality reflecting clonal expansion.
- Percent of estimated T cells correlated with BrM volume.(r = −0.7310, P = 0.0252).
- Gini indices of BrM samples correlated with BrM volume (r = −0.9453, P = 0.0001).
Data information: In (B–D + G), data are represented as scattered dot plot with line mean ± SD. P‐values were obtained by Mann–Whitney test for (C, D) and unpaired t‐test for (G) with **P < 0.01, and ***P < 0.001. For Control: n = 5 for BrM and CLN, for WBRT: n = 4 for BrM and n = 5 for CLN. In (H, I), the simple linear regression was plotted and Pearson’s correlation was used to obtain correlation coefficient r with P‐value. Exact P‐values can be found in Appendix Table S3.
Source data are available online for this figure.