
Figure EV5. Spatial distribution of immune cells in BrM after treatment.
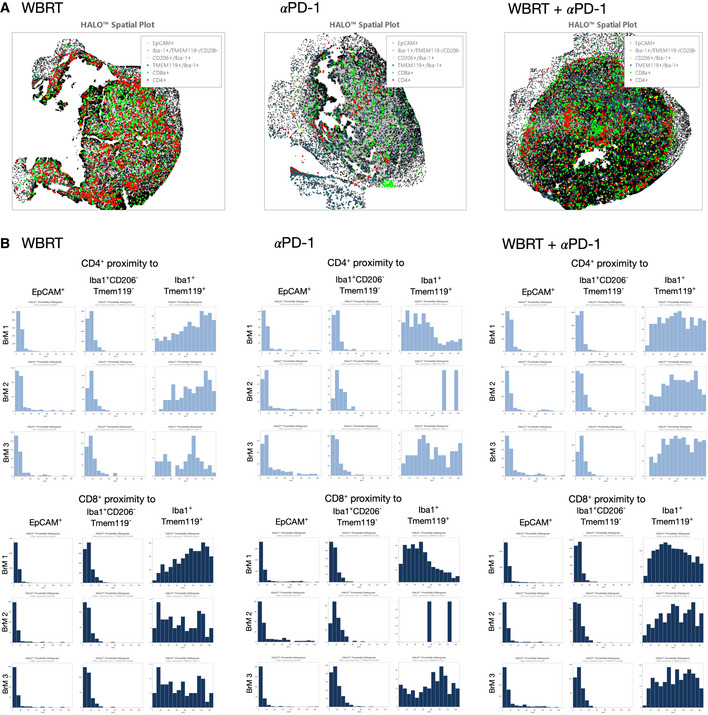
- Representative halo spatial plot showing the spatial distribution of cell types with indicated marker combination in 99LN‐BrM in response to treatment with WBRT, αPD‐1, and WBRT + αPD‐1.
- HALO proximity histograms depict the distance in µm between the indicated cell types in BrM lesions for individual mice in response to treatment (n = 3 per condition).
Source data are available online for this figure.