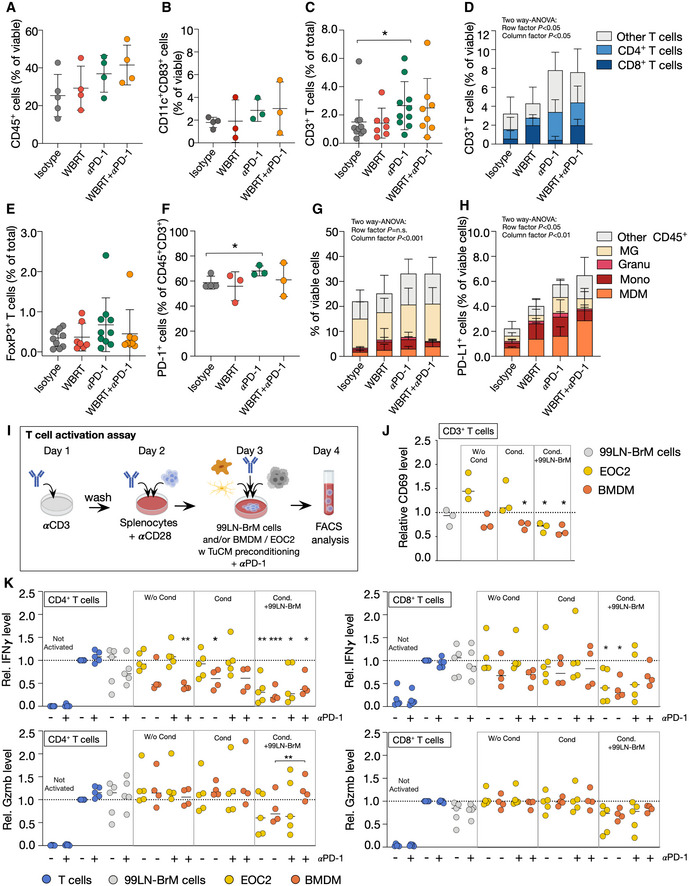
Figure 7. Effects of radio‐immunotherapy on T cells and myeloid cells in breast cancer‐derived BrM.

- CD45+ immune cells infiltrating 99LN‐BrM (n = 5 for isotype, n = 4 for the other groups).
- Flow cytometric analysis of dendritic cell (CD45+CD11c+CD83+) infiltration (n = 4 for isotype, n = 3 for all other groups).
- Quantitative analysis of IHC CD3+ T cells at trial end point (n = 10 for isotype, n = 7 for WBRT, n = 10 for αPD‐1, and n = 8 for WBRT + αPD‐1 group).
- Flow cytometric analysis of T‐cell subpopulations in 99LN‐BrM (n = 4 for isotype, n = 3 for all other groups).
- Quantitative analysis of IHC FoxP3+ T cells at trial end point (n = 10 for isotype, n = 7 for WBRT, n = 10 for αPD‐1, and n = 8 for WBRT + αPD‐1 group).
- Flow cytometric analysis of PD‐1 expression on T cells in response to different treatments (control n = 4, all other groups n = 3).
- Composition of the myeloid compartment in 99LN‐BrM in the different treatment groups (n = 5 for isotype, all other groups n = 4).
- Relative abundance (%) of PD‐L1+ myeloid cell types in BrM samples of the four treatment groups (n = 5 for isotype, all other groups n = 4).
- Experimental design of the in vitro T‐cell activation assay.
- Relative CD69 protein level on T cells cultivated with different cell types, unstimulated, or stimulated with tumor‐conditioned media (Cond.) (n = 3).
- Relative Gzmb and IFNγ protein level on CD4+ and CD8+ T cells cultivated with different cell types, with or without αPD‐1 and unstimulated or stimulated with tumor‐conditioned media (Cond.) (n = 4 for conditions including BMDM, n = 5 for all other conditions).
Data information: Data in (A–C, E + F) are represented as scattered dot plot with line at mean ± SD. Data in (D + G + H) are represented as stacked columns ± SD. Data in (J + K) are represented as scattered dot plot with line at median. Dotted line depicts baseline T‐cell activation. P‐values were obtained by Mann–Whitney test in (C) unpaired t‐test in (F), two‐way ANOVA in (D, G and H), and paired t‐test in (J and K) with *P < 0.05 and **P < 0.01, and ***P < 0.001. Exact P‐values can be found in Appendix Table S3.
Source data are available online for this figure.
