
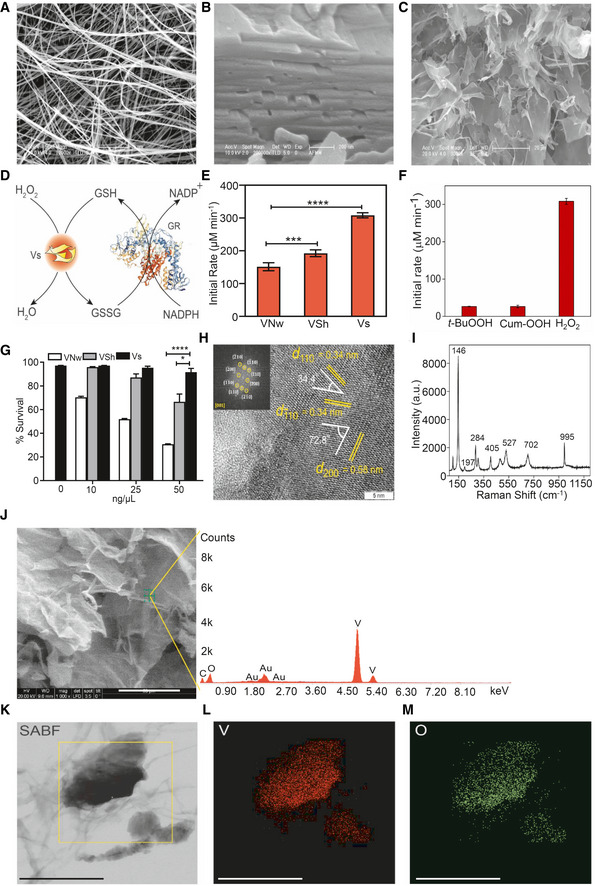
Figure 1. Synthesis and characterization of vanadia (V2O5) nanoparticles.
-
A–CScanning electron microscopy (SEM) images of (A) nanowires (VNw; scale – 5 µm) and (B) crude nanosheets (VSh; scale – 200 nm), (C) ultrathin nanosheets (Vs), scale – 20 µm.
-
DSchematic representing the glutathione reductase (GR)‐coupled assay to measure the GPX‐like activity of Vs.
-
EComparison of initial activity rate among all three forms of V2O5 nanomaterials having a common exposed facet [001].
-
FBar diagram of the initial rate of Vs with 3 different peroxides, t‐BuOOH—tertiary‐butyl hydroperoxide, Cum‐OOH—cumene hydroperoxide and H2O2.
-
GU1 cells were treated with increasing concentrations of VNw, VSh, or Vs – 10 to 50 ng/μl‐ for 15 min, and cell survival was analyzed by flow cytometry after 24 h by propidium iodide (PI) staining.
-
HHigh‐resolution TEM (HRTEM) and fast Fourier transform (FFT) (inset) of Vs showing the lattice fringes and the exposed plane.
-
IFT‐Raman spectroscopy of Vs showing the peaks corresponding to the orthorhombic phase of the material.
-
J–MEnergy dispersive spectroscopy (EDS) of Vs (J). The small peak at 2.0 KeV is due to Au sputtering while recording the spectra (Scale – 50 µm). The peak of C is coming from atmospheric carbon. X‐Ray mapping images of Vs (Scale – 300 nm). (K) Left column: Selective area bright field (SABF) image, (L) middle column: distribution of vanadium (V) atoms in red, (M) right column: distribution of oxygen (O) atoms in green.
Data information: *P < 0.05, ***P < 0.001, ****P < 0.0001 by Student’s t test. (E) and (F) Data are representative of three independent experiment (mean ± SEM). (G) Data are representative of two independent experiments done in duplicate (mean ± SEM).