
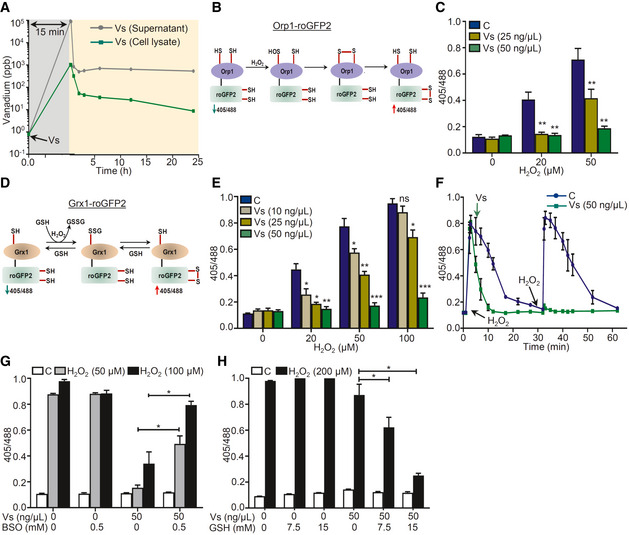
Figure 3. Vs acts as a mimic of GPX in U1 cells.
-
AU1 cells were treated with 50 ng/μl of Vs for 15 min (gray area), washed, and lysed, and kinetics of Vs internalization and retention (yellow area) was quantified by subjecting cell lysate and supernatant to ICP‐MS for measuring intracellular and extracellular Vs, respectively.
-
BSchematic representation showing working principle of Orp1‐roGFP2 biosensor.
-
CU1‐Orp1‐roGFP2 cells were treated with Vs for 15 min, followed by exposure to H2O2 for 2 min, and ratiometric response was measured.
-
DSchematic representation showing working principle of Grx1‐roGFP2 biosensor.
-
EU1‐Grx1‐roGFP2 cells were pre‐treated with Vs for 15 min, exposed to H2O2 for 2 min, and ratiometric response was measured.
-
FU1‐Grx1‐roGFP2 cells were treated with two doses of 50 μM H2O2 (black arrows) and the ratiometric response was measured (blue line). Parallelly, U1 cells treated similarly with H2O2 were exposed to Vs at the indicated time point and the ratiometric response was measured (green line). ****P < 0.0001, by Wilcoxon matched‐pairs signed rank test.
-
G, HU1 Grx1‐roGFP2 cells were supplemented with BSO (G) or GSH (H) for 16 h to deplete or replenish GSH, respectively. Following this, cells were treated with Vs for 15 min and exposed to H2O2, and the ratiometric response was measured.
Data information: Data are representative of results from three independent experiments performed in duplicate (mean ± SEM). ***P < 0.001, **P < 0.01, *P < 0.05, by Mann–Whitney test. Asterisks (*) compare Vs‐treated cells with control cells (C).