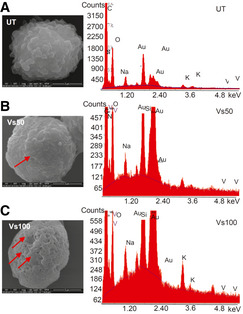
Figure EV3. EDS coupled scanning electron microscopy analysis of Vs‐treated U1 cells.

-
A–CU1 cells were either left untreated (A) or treated with (B) 50 and (C) 100 ng/µl of Vs for 15 min and immediately harvested followed by fixation, dehydration, and imaging by scanning electron microscopy. Left panels: The depressions (marked by arrows) formed on the cell surface (B and C). Scale bar 3 µm (A) and (B), 5 µm (C). Right panels: The depressions on cell surfaces due to Vs internalization were verified by EDS analysis on the depressed regions. The EDS plots showing the absence or presence of vanadium peak in untreated and Vs‐treated U1 cells, respectively.
Source data are available online for this figure.
