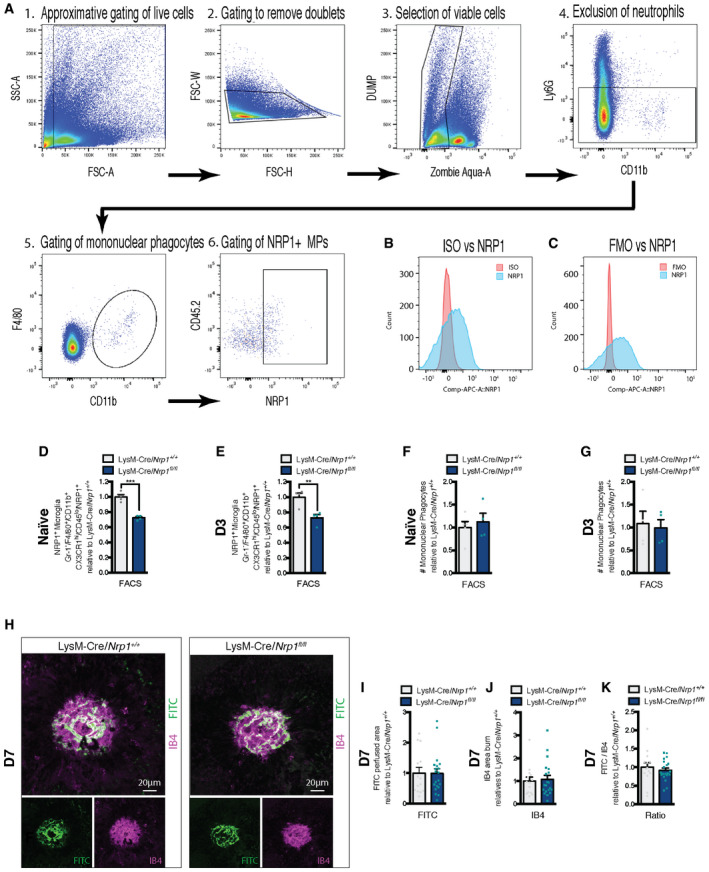
Figure EV1. Mononuclear phagocyte‐resident NRP1 expression in LysM‐Cre/Nrp1fl/fl .

-
AGating scheme explaining the identification of the Ly6G−, F4/80+, CD11b+, and NRP1+ mononuclear phagocytes in retinas and sclera‐choroid‐RPE cell complexes. 1. Gating of live cells, 2. Removal of doublets, 3. Selection of viable cells, 4. Exclusion of neutrophils, 5. Gating of mononuclear phagocytes, 6. Gating of NRP1+ mononuclear macrophages.
-
BFACS histogram of APC‐conjugated rat IgG2A isotype control (red) versus anti‐mNRP1 APC‐conjugated rat IgG2A (R&D systems) (blue).
-
CFACS histogram of FMO (fluorescence minus one) versus anti‐mNRP1 APC‐conjugated rat IgG2A.
-
D, EQuantification of NRP1‐positive microglia (Ly6G−, F4/80+, CD11b+, CX3CR1hi, CD45lo, NRP1+) in retinas and sclera‐choroid‐RPE cell complexes in Naïve (non‐burned) mice (D); n = 4 and at D3 (E); n = 4.
-
F, GQuantification of mononuclear phagocytes (Ly6G−, F4/80+, CD11b+) in retinas and sclera‐choroid‐RPE cell complexes in Naïve (non‐burned) mice (F); n = 5 (LysM‐Cre/Nrp1+/+), 4 (LysM‐Cre/Nrp1fl/fl) and at D3 (G); n = 4.
-
HCompilation of representative compressed Z‐stack confocal images of FITC–dextran‐labeled CNV and IB4‐stained laser impact area from LysM‐Cre/Nrp1+/+ and LysM‐Cre/Nrp1fl/fl mice at D7. Scale bar: 20 μm.
-
I–KQuantification of area of FITC–dextran‐labeled CNV (I), isolectin B4 (IB4)‐stained laser impact area (J) and the ratio of FITC/IB4 per laser burn (K) relative to LysM‐Cre/Nrp1+/+ at D7; n = 14 burns (LysM‐Cre/Nrp1+/+), n = 20 burns (LysM‐Cre/Nrp1fl/fl).
Data information: All comparisons between groups were analyzed using a Student’s unpaired t‐test; **P < 0.01, ***P < 0.001; error bars represent mean ± SEM; exact P‐values listed in Table 2.
