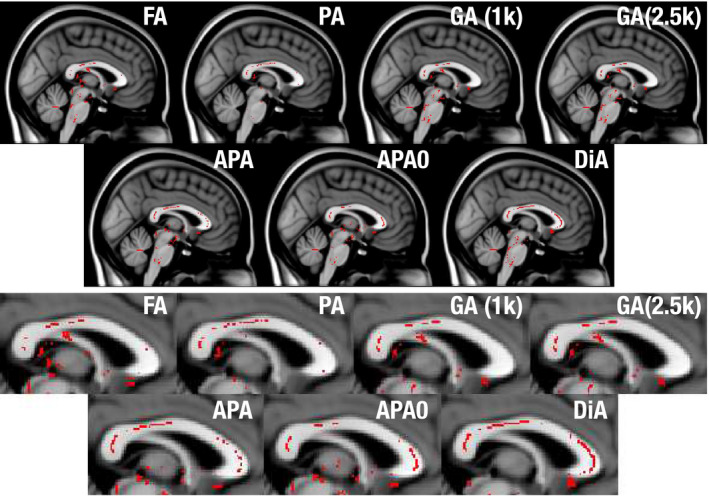
FIGURE 4.

Significant differences found by statistical test for the Parkinson database, using a voxel‐wise analysis over the FA skeleton for the different considered metrics (sagittal view). In red, those points where the considered metric decreases in the PD with respect to the controls with statistical significance above 99% (P < .01)
