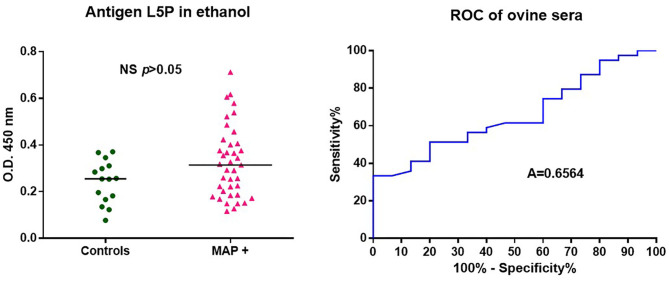
Figure 3.
ROC analysis of antibody response of ovine sera against L5P. Analysis performed on a panel of sera from 39 MAP positive (MAP +) and 15 control animals, using L5P coated in ethanol. All results are expressed as individual OD and were compared by ROC analysis. The horizontal bars indicate median. Area under the receiver operating characteristic curve. Significantly different when p < 0.05. Not significantly different (NS).

