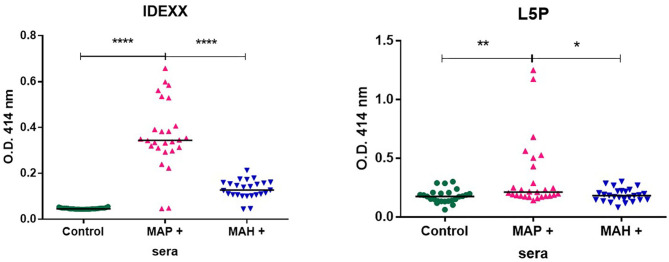
Figure 4.
Antibody response from goats uninfected (n = 27) or experimentally infected with MAP (n = 25) or MAH (n = 26), as analyzed by IDEXX test or using L5P antigen. Results are shown as OD450 nm of individual samples and medians are indicated as a black line. The statistical differences between the groups were determined using the non-parametric Mann–Whitney test. Significantly different when p < 0.05. *p < 0.05, **p < 0.01, and ****p < 0.0001.

