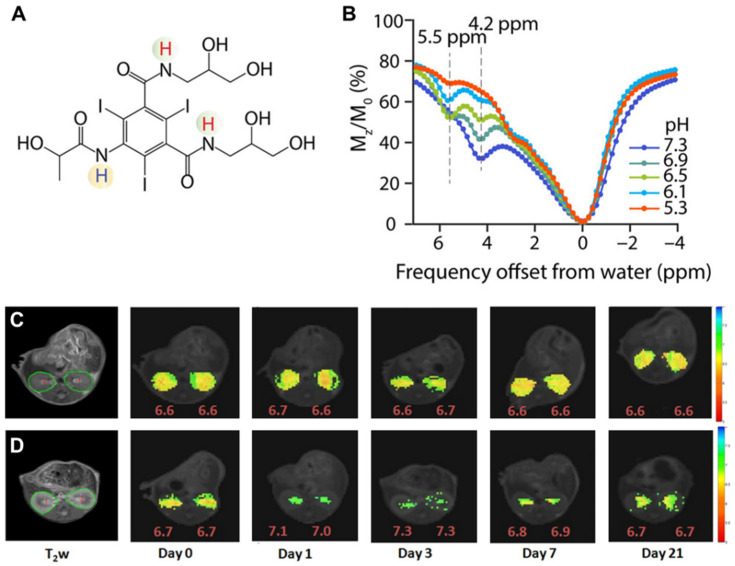
Figure 5.
Iopamidol as pH imaging agent tested in mice. (A) Structure of iopamidol with exchangeable protons highlighted, which produce CEST contrast at 4.2 and 5.5 ppm; (B) CEST Z-spectra of iopamidol in blood serum for pH = 5.3, 6.1, 6.5, 6.9, and 7.3. Panels (C,D) adopted from Pavuluri et al. in [70]; Representative anatomical (T2w) and superimposed color-coded pH maps obtained 15 min after Iopamidol injection at indicated time points in control group (C) and in AKI group (D). Panels (C,D) adopted from Longo et al. in [69].

