Figure 6.
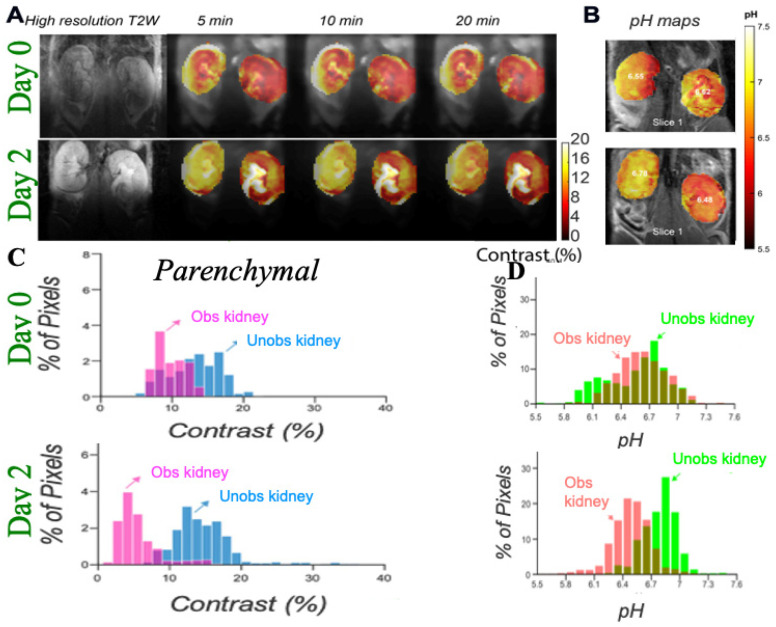
Imaging UUO in mice using iopamidol CEST MRI; (A) Representative T2w and CEST MRI contrast maps at 4.2 ppm on a UUO mouse with right kidney obstructed on day 0 and 2 post surgery with iopamidol dose = 1 g I/kg, B1 =4 μT, 2 offset protocol, as in reference [70], to minimize pH mapping time and allow averaging for the production of high contrast to noise ratio (CNR) motion artifact compensated CEST maps; Dynamic CEST images were acquired at offsets 4.2, 5.5 ppm repeatedly for 80 min using a CW RF saturation of duration 2.1 s (7 rectangular block pulses each of 300 ms with 10 μs interpulse delay). TE/TR = 3.55/11,000 ms; Rapid Acquisition with Relaxation Enhancement with short echo time (RAREst) acquisition module and centric encoding were used. In total, 10 sets of M0 offsets at 40 ppm were acquired for normalization. Time interval between two dynamic CEST images was 44 s. Moving time average of 10 dynamic CEST images was performed to compensate the motion induced artifacts in CEST contrast with the B1 employed rendering the maps sufficiently insensitive to the B0 homogeneity across the kidneys shown in the B0 maps as described in reference [70]. The images depict differences in marker perfusion for left and right kidneys due to hydronephrosis and resulting functional impairment; (B) pH maps using images acquired 5 min after iopamidol administration. pH was calculated using the ratio of CEST contrast at 4.2, 5.5 ppm and the calibration curve obtained using the iopamidol phantom at pH values between 5.3 and 7.3; (C) Parenchymal contrast histograms which display reduced contrast for obstructed kidney cortex and a larger variation in contrast for the obstructed kidney calyx; (D) pH histograms which display an increase in ΔpH over time after UUO first in obstructed kidney and later in unobstructed kidney which is similar to what was observed in MMA induced CKD in mice.

