FIGURE 5.
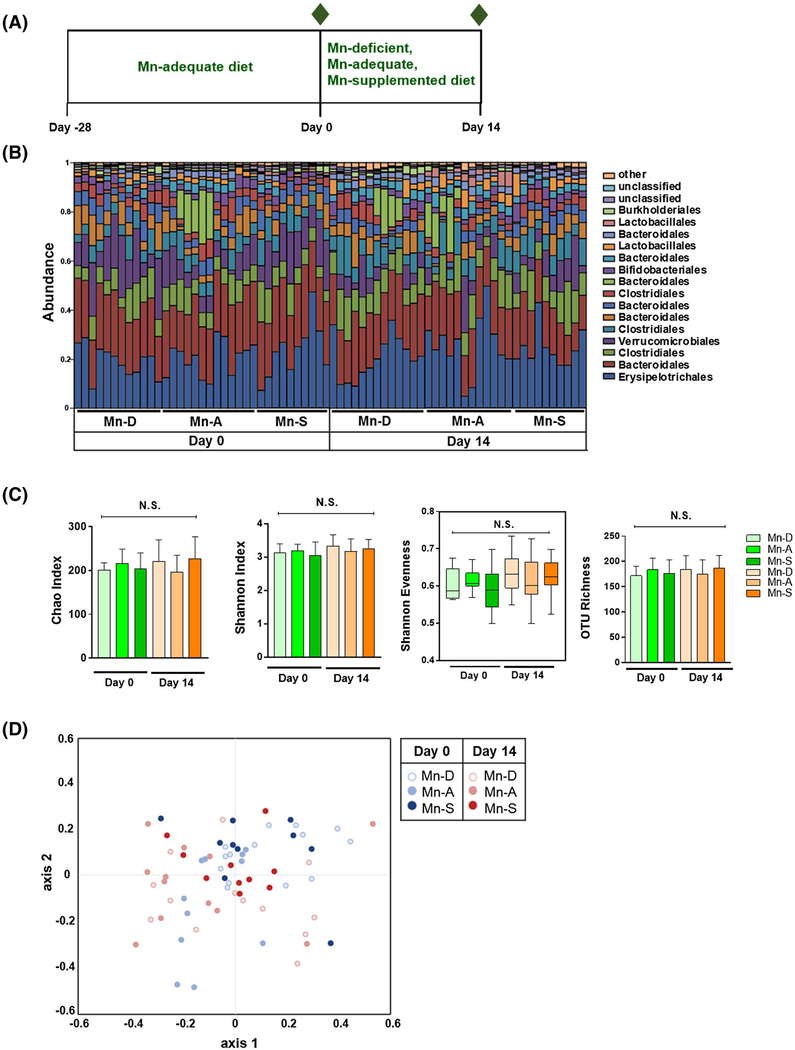
Effect of dietary Mn alterations on the gut microbiota. A, Schematic of dietary Mn alterations. Four-week-old mice were co-housed and fed a Mn-adequate diet (35 mg/kg Mn) for 28 days and then fed with either Mn-deficient, Mn-adequate, or Mn-supplemented diets (0, 35, or 300 mg/kg Mn, respectively) for 14 days. The composition of the fecal microbiota was analyzed on Day 0 and Day14 (indicated by green diamonds) (n = 10–12 per group). B, Relative abundance of dominant bacterial families in feces collected from mice fed different diets on Day 0 and Day 14. C, The α diversity, including Chao, Shannon diversity, Shannon evenness, and OTU richness indexes, of fecal microbiota composition from mice fed different diets on Day 0 and Day 14. Data represents means ± SEM for Chao, Shannon diversity, and OTU richness indexes. Boxes represent the interquartile range between the first and third quartiles (25th and 75th percentiles, respectively), the horizontal line inside the box defines the median, and whiskers represent the lowest and highest values for Shannon evenness. NS = not significant; the Shapiro-Wilk normality test, followed by the Kolmogorov-Smirnov test, normality test. D, NMDS plot of β-diversity values (θYC indexes) of microbiota in fecal pellets from mice fed different diets on Day 0 and Day 14 is shown with the minimal stress (stress = 0.144335) after 1,000 iterations (n = 10 per group). Overall, no significant difference was noted in β-diversity between microbiota between different groups on Day 0 and Day 14 with P > .05 (permutational multivariate analysis of variance [PERMANOVA]). See Tables S4–S6

